 PDF
PDF  Views
Views  Share
Share


Sociodemographic Features of Cancer Patients Registered at a Single Rural Cancer Hospital in Western India
CC BY-NC-ND 4.0 · Indian J Med Paediatr Oncol 2020; 41(03): 372-377
DOI: DOI: 10.4103/ijmpo.ijmpo_227_19
Abstract
Aim: The aim of the study was to know the sociodemographic features of cancer patients registered at a rural cancer hospital in Western India. Materials and Methods: The demographic and clinical data were extracted from the medical records of the newly registered patients at the cancer center in the calendar year 2018. Results: Atotal of 2813 new patients were registered who were confirmed to have a malignancy. The median age was 59 years for males and 55 years for females. Mouth, tongue, esophagus, hypopharynx, and lung were the leading five sites in men, whereas breast, cervix, ovary, mouth, and esophagus were the leading five sites in women. The proportion of cancer patients above the age of 65 years at the center was more than the other neighboring hospital-based cancer registries. The proportion of tobacco consumption in female patients was found to be higher.
Keywords
Cancer - demography - hospital-based cancer registry - rural IndiaPublication History
Received: 08 November 2019
Accepted: 19 May 2020
Article published online:
28 June 2021
© 2020. Indian Society of Medical and Paediatric Oncology. This is an open access article published by Thieme under the terms of the Creative Commons Attribution-NonDerivative-NonCommercial-License, permitting copying and reproduction so long as the original work is given appropriate credit. Contents may not be used for commercial purposes, or adapted, remixed, transformed or built upon. (https://creativecommons.org/licenses/by-nc-nd/4.0/.)
Thieme Medical and Scientific Publishers Pvt. Ltd.
A-12, 2nd Floor, Sector 2, Noida-201301 UP, India
Abstract
Aim: The aim of the study was to know the sociodemographic features of cancer patients registered at a rural cancer hospital in Western India. Materials and Methods: The demographic and clinical data were extracted from the medical records of the newly registered patients at the cancer center in the calendar year 2018. Results: Atotal of 2813 new patients were registered who were confirmed to have a malignancy. The median age was 59 years for males and 55 years for females. Mouth, tongue, esophagus, hypopharynx, and lung were the leading five sites in men, whereas breast, cervix, ovary, mouth, and esophagus were the leading five sites in women. The proportion of cancer patients above the age of 65 years at the center was more than the other neighboring hospital-based cancer registries. The proportion of tobacco consumption in female patients was found to be higher.
Keywords
Cancer - demography - hospital-based cancer registry - rural IndiaIntroduction
Cancer is the second leading cause of death worldwide.[1] Cancer burden in India varies substantially across the length and breadth of the country. The two popular cancer registries in India are Population-Based Cancer Registries (PBCR) and Hospital-Based Cancer Registries (HBCR). The Global Burden of Diseases, Injuries, and Risk Factors Study 2016 estimated that the incidence of cancer in India has increased from 548,000 in 1990 to 1,069,000 in 2016, and the crude cancer incidence rate in India has increased from 63.4 / 100,000 in 1990 to 81.2 / 100,000 in 2016.[2] Here, we present the data from Kolhapur Cancer Centre (KCC) which is a comprehensive cancer center from the western part of India situated at the border of Maharashtra, Karnataka, and Goa states. The aim of the study was to find the sociodemographic pattern of the patients coming to our center to formulate the strategies for the management. It gave us an estimate of the number of cancer patients and leading sites of cancer cases attending the cancer center. We also compared our data with the data published from the neighboring HBCRs, namely Tata Memorial Hospital (TMH), Mumbai; Kidwai Memorial Institute of Oncology (KMIO), Bengaluru; and Rashtra Sant Tukadoji (RST) Regional Cancer Hospital, Nagpur, and one rural PBCR, i.e., Barshi, Maharashtra, situated approximately 400 km, 600 km, 850 km, and 250 km north, south, east, and north-east of the present study center, respectively.[3],[4]
Materials and Methods
This was a retrospective study carried out at KCC, India. After ethics committee approval, all the cancer patients registered at the center from January 1, 2018, to December 31, 2018, were included in the study. The demographic and clinical data were extracted from the medical records in the patient files and electronic database of these patients.
Statistical analysis
The data were collected, compiled, and summarized using percentages and proportions using IBM SPSS Statistics for Windows, version 21 (IBM Corp., Armonk, NY, USA).
Results
The total number of new patients registered in the year 2018 was 3658. The medical records of 3534 patients could be retrieved. The total number of histologically proven cancer patients was 2813 (79.6%). On an average, 234 new cancer patients were registered in each month. Nearly 80% of the patients were from the state of Maharashtra and the rest were from neighboring states. The state-, district-, and taluka-wise distribution is shown in [Table 1], [Table 2], [Table 3].
State-wise distribution of patients
|
State |
Number of patients (%) |
|---|---|
|
Maharashtra |
2248 (79.9) |
|
Maharashtra |
543 (19.3) |
|
Others |
22 (0.8) |
|
Total |
2813 (100) |
District-wise distribution of patients
|
District |
Number of patients (%) |
|---|---|
|
Kolhapur |
1569 (55.9) |
|
Belgaum |
492 (17.5) |
|
Sangli |
309 (11) |
|
Satara |
117 (4.1) |
|
Sindhudurg |
108 (3.8) |
|
Others |
218 (7.7) |
|
Total |
2813 (100) |
Taluka-wise distribution of patients in Kolhapur District
|
Talukas in Kolhapur district |
Subsite |
|---|---|
|
Karvir |
451 (28.7) |
|
Hatkanangale |
342 (21.8) |
|
Kagal |
151 (9.6) |
|
Gadhinglaj |
111 (7.1) |
|
Shirol |
97 (6.2) |
|
Panhala |
87 (5.5) |
|
Chandgad |
80 (5.1) |
|
Radhanagari |
68 (4.3) |
|
Bhudargad |
63 (4) |
|
Shahuwadi |
60 (3.8) |
|
Ajara |
50 (3.2) |
|
Gaganbawda |
9 (0.6) |
|
Total |
1569 (100) |
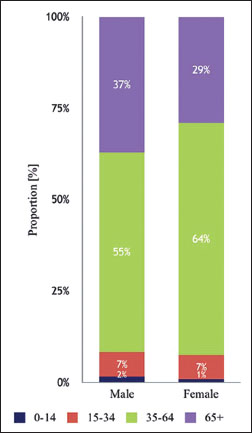
| Figure 1: Stack diagram showing proportion of cancers by broad age
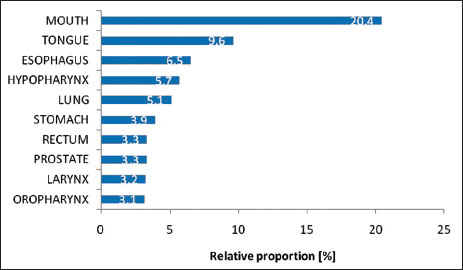
| Figure 2: Top ten leading sites of cancer in males
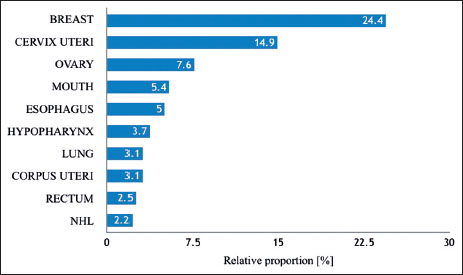
| Figure 3: Top ten leading sites of cancer in females
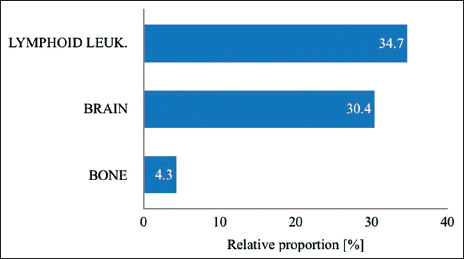
| Figure 4: Leading sites in broad age group (0–14 years) – male
| Figure 5: Leading sites in broad age group (0–14 years) – female
| Figure 6: Leading sites in broad age group (15–34 years) – male
| Figure 7: Leading sites in broad age group (15–34 years) – female
| Figure 8: Leading sites in broad age group (35–64 years) – male
| Figure 9: Leading sites in broad age group (35–64 years) – female
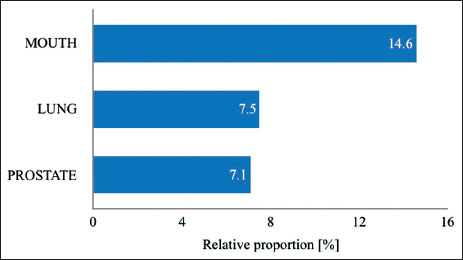
| Figure 10: Leading sites in broad age group (65+ years) – male
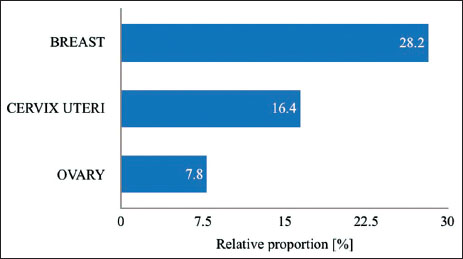
| Figure 11: Leading sites in broad age group (65+ years) – female
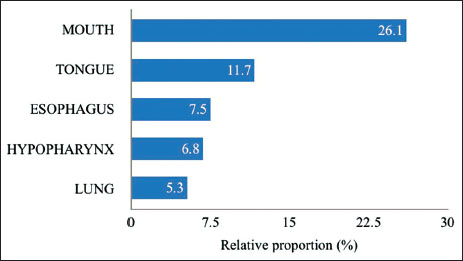
| Figure 12: Top five cancer sites in male with addiction of tobacco and/ or alcohol
| Figure 13: Top five cancer sites in female with addiction of tobacco and/ or alcohol
| Figure 14: Stage at presentation
Table 4Number (#) and proportion (%) of cancers by broad age groups
|
Gender |
Age, n (%) |
Total |
|||
|---|---|---|---|---|---|
|
0-14 |
15-34 |
35-64 |
65+ |
||
|
Male |
23 (1.6) |
97 (6.7) |
784 (54.6) |
534 (37.1) |
1438 |
|
Female |
13 (0.9) |
90 (6.5) |
873 (63.4) |
399 (29.0) |
1375 |
|
Total |
36 (1.3) |
166 (5.9) |
1678 (59.6) |
933 (33.2) |
2813 |
Top ten leading sites of cancer in males
|
Site |
n (%) |
|---|---|
|
n– Absolute number, % - Proportion |
|
|
Mouth |
294 (20.4) |
|
Tongue |
139 (9.6) |
|
Esophagus |
94 (6.5) |
|
Hypopharynx |
82 (5.7) |
|
Lung |
73 (5.1) |
|
Stomach |
57 (3.9) |
|
Prostate |
48 (3.3) |
|
Rectum |
47 (3.3) |
|
Larynx |
46 (3.2) |
|
Oropharynx |
45 (3.1) |
Top ten leading sites of cancer in females
|
Site |
n (%) |
|---|---|
|
n– Absolute number, % - Proportion; NHL – Non-Hodgkin’s lymphoma |
|
|
Breast |
335 (24.4) |
|
Cervix uteri |
205 (14.9) |
|
Ovary |
104 (7.6) |
|
Mouth |
74 (5.4) |
|
Esophagus |
69 (5.0) |
|
Hypopharynx |
51 (3.7) |
|
Lung |
43 (3.1) |
|
Corpus uteri |
42 (3.1) |
|
Rectum |
34 (2.5) |
|
NHL |
30 (2.2) |
Table 8 Top ten sites of cancer in female comparison with neighboring cancer registries
Table 9Leading sites in broad age groups (0-14 years) - male
|
Site |
n (%) |
|---|---|
|
Lymphoid leukemia |
8 (34.7) |
|
Brain |
7 (30.4) |
|
Bone |
1 (4.3) |
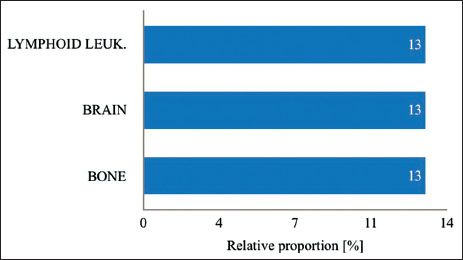
Leading sites in broad age groups (0-14 years) - female
|
Site |
n (%) |
|---|---|
|
Lymphoid leukemia |
3 (13) |
|
Brain |
3 (13) |
|
Bone |
3 (13) |
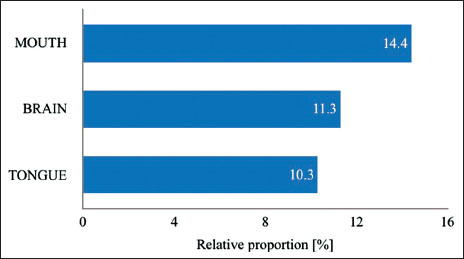
Leading sites in broad age groups (15-34 years) - male
|
Site |
n (%) |
|---|---|
|
Mouth |
14 (14.4) |
|
Brain |
11 (11.3) |
|
Tongue |
10 (10.3) |
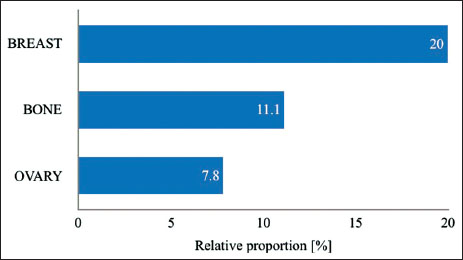
Leading sites in broad age groups (15-34 years) - female
|
Site |
n (%) |
|---|---|
|
Breast |
18 (20.0) |
|
Bone |
10 (11.1) |
|
Ovary |
7 (7.8) |
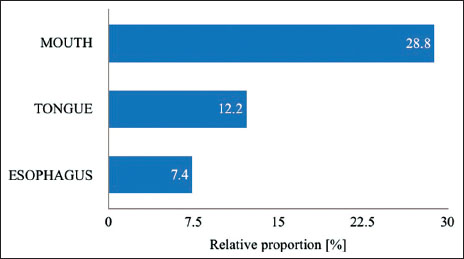
Leading sites in broad age groups (35-64 years) - male
|
Site |
n (%) |
|---|---|
|
Mouth |
226 (28.8) |
|
Tongue |
96 (12.2) |
|
Esophagus |
56 (7.4) |
Leading sites in broad age groups (35-64 years) - female
|
Site |
n (%) |
|---|---|
|
Breast |
246 (28.8) |
|
Cervix uteri |
143 (16.4) |
|
Ovary |
68 (7.8) |
Leading sites in broad age groups (65+ years) - male
|
Site |
n (%) |
|---|---|
|
Mouth |
78 (14.6) |
|
Lung |
40 (7.5) |
|
Prostate |
38 (7.1) |
Leading sites in broad age groups (65+ years) - female
|
Site |
n (%) |
|---|---|
|
Breast |
70 (17.5) |
|
Cervix |
56 (14.0) |
|
Ovary |
29 (7.3) |
Addictions
|
Tobacco (%) |
Alcohol (%) |
|||||
|---|---|---|---|---|---|---|
|
Yes |
No |
Unknown |
Yes |
No |
Unknown |
|
|
Male |
963 (67.0) |
319 (22.2) |
156 (10.8) |
337 (23.4) |
945 (65.8) |
156 (10.8) |
|
Female |
447 (32.5) |
721 (52.4) |
207 (15.1) |
3 (0.2) |
1165 (84.7) |
207 (15.1) |
|
Both genders |
1410 (50.1) |
1040 (37.0) |
363 (12.9) |
340 (12.1) |
2110 (75.0) |
363 (12.9) |
Top five cancer sites in male with addiction of tobacco and/or alcohol
|
Total (n=996), n (%) |
|
|---|---|
|
Mouth |
260 (26.1) |
|
Tongue |
117 (11.7) |
|
Esophagus |
75 (7.5) |
|
Hypopharynx |
68 (6.8) |
|
Lung |
53 (5.3) |
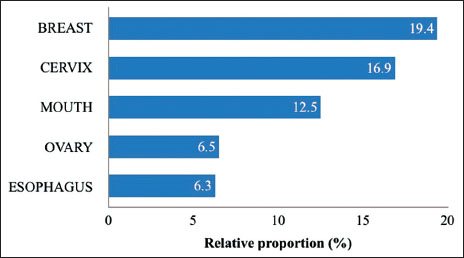
Top five cancer sites in female with addiction of tobacco and/or alcohol
|
Total (n=996), n (%) |
|
|---|---|
|
Breast |
87 (19.4) |
|
Cervix |
76 (16.9) |
|
Mouth |
56 (12.5) |
|
Ovary |
29 (6.5) |
|
Esophagus |
28 (6.3) |
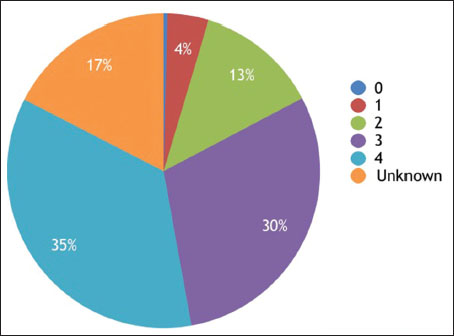
Stage at presentation
|
Stage |
n (%) |
|---|---|
|
0 |
11 (0.4) |
|
1 |
119 (4.2) |
|
2 |
357 (12.7) |
|
3 |
839 (29.8) |
|
4 |
996 (35.4) |
|
Unknown |
491 (17.5) |
|
Total |
2813 (100) |
Discussion
Cancer registration helps us to know the cancer burden seen at a particular hospital, which reflects the population burden catered by the hospital. To our knowledge, this is the first report of a hospital-based cancer patient data registered at a rural nonacademic cancer center in the western part of India bordering the states of Maharashtra, Karnataka, and Goa. The leading sites of cancers in males are all tobacco related, namely mouth, tongue, esophagus, hypopharynx, and lung. The leading sites of cancers in females are breast, cervix, ovary, mouth, and esophagus. This pattern matches with the neighboring HBCRs. Needless to say, tobacco is the leading cause of majority of the cancer burden at this center. The proportion of tobacco consumption in female patients was found to be higher than that in another study.[5] Mouth cancer proportion in male patients is found to be 20.4% at KCC, which is more than TMH (14.0%), Barshi (8.6%), KMIO (7.6%), and similar to RST (20.9%), whereas the proportion of lung cancer in male patients is found to be 5.1% at KCC, which is less than TMH (7.9%), KMIO (7.6%), and RST (8.7%). More prevalence of smokeless tobacco with alcohol consumption than smoked tobacco could be the reason for this. The leading sites of cancer in female patients match with the other centers. This study gave us an insight into the leading sites of cancer in our region and the need to formulate the strategies to cater these patients without significant loss to follow-up.
Limitations
As the study was done for 12 months, the exact pattern of cancer prevalent in the region could not be estimated. Complete data from patients pertaining to treatment details, follow-up, and outcome could not be retrieved owing to the short study period. Further, we acknowledge the limitations of the patient data registered in a cancer hospital as it does not necessarily the true population picture.
Conflict of Interest
There are no conflicts of interest.
References
- Global, regional, and national cancer incidence, mortality, years of life lost, years lived with disability, and disability-adjusted life-years for 29 cancer groups, 1990 to 2016: A systematic analysis for the Global Burden of Disease study. GBD 2016 Cancer Collaborators. JAMA Oncol 2018; 4: 1553-68
- The burden of cancers and their variations across the states of India: The Global Burden of Disease Study 1990–2016 India State-Level Disease Burden Initiative Cancer Collaborators. Lancet Oncol 2018; 19: 1289-306
- Available from: http://ncdirindia.org/ncrp/ALL_NCRP_REPORTS/HBCR_REPORT_2012_2014/ALL_CONTENT/PDF_Printed_Version/Chapter1.pdf. [Last accessed on 2019 Oct 01].
- Available from: http://ncdirindia.org/ncrp/ALL_NCRP_REPORTS/PBCR_REPORT_2012_2014/ALL_CONTENT/PDF_Printed_Version/Chapter2_Printed.pdf. [Last accessed on 2019 Oct 01].
- Murthy NS, Rajaram D, Gautham MS, Shivaraj NS, Nandakumar BS, Pruthvish S. Risk of cancer development in India. Asian Pac J Cancer Prev 2011; 12: 387-91
Address for correspondence
Publication History
Received: 08 November 2019
Accepted: 19 May 2020
Article published online:
28 June 2021
© 2020. Indian Society of Medical and Paediatric Oncology. This is an open access article published by Thieme under the terms of the Creative Commons Attribution-NonDerivative-NonCommercial-License, permitting copying and reproduction so long as the original work is given appropriate credit. Contents may not be used for commercial purposes, or adapted, remixed, transformed or built upon. (https://creativecommons.org/licenses/by-nc-nd/4.0/.)
Thieme Medical and Scientific Publishers Pvt. Ltd.
| Figure 1: Stack diagram showing proportion of cancers by broad age
| Figure 2: Top ten leading sites of cancer in males
| Figure 3: Top ten leading sites of cancer in females
| Figure 4: Leading sites in broad age group (0–14 years) – male
| Figure 5: Leading sites in broad age group (0–14 years) – female
| Figure 6: Leading sites in broad age group (15–34 years) – male
| Figure 7: Leading sites in broad age group (15–34 years) – female
| Figure 8: Leading sites in broad age group (35–64 years) – male
| Figure 9: Leading sites in broad age group (35–64 years) – female
| Figure 10: Leading sites in broad age group (65+ years) – male
| Figure 11: Leading sites in broad age group (65+ years) – female
| Figure 12: Top five cancer sites in male with addiction of tobacco and/ or alcohol
| Figure 13: Top five cancer sites in female with addiction of tobacco and/ or alcohol
| Figure 14: Stage at presentation
References
- Global, regional, and national cancer incidence, mortality, years of life lost, years lived with disability, and disability-adjusted life-years for 29 cancer groups, 1990 to 2016: A systematic analysis for the Global Burden of Disease study. GBD 2016 Cancer Collaborators. JAMA Oncol 2018; 4: 1553-68
- The burden of cancers and their variations across the states of India: The Global Burden of Disease Study 1990–2016 India State-Level Disease Burden Initiative Cancer Collaborators. Lancet Oncol 2018; 19: 1289-306
- Available from: http://ncdirindia.org/ncrp/ALL_NCRP_REPORTS/HBCR_REPORT_2012_2014/ALL_CONTENT/PDF_Printed_Version/Chapter1.pdf. [Last accessed on 2019 Oct 01].
- Available from: http://ncdirindia.org/ncrp/ALL_NCRP_REPORTS/PBCR_REPORT_2012_2014/ALL_CONTENT/PDF_Printed_Version/Chapter2_Printed.pdf. [Last accessed on 2019 Oct 01].
- Murthy NS, Rajaram D, Gautham MS, Shivaraj NS, Nandakumar BS, Pruthvish S. Risk of cancer development in India. Asian Pac J Cancer Prev 2011; 12: 387-91