 PDF
PDF  Views
Views  Share
Share


A Radiologist's Perspective on Treatment-Related Pseudoprogression: Clues and Hues
CC BY-NC-ND 4.0 · Indian J Med Paediatr Oncol 2022; 43(01): 052-059
DOI: DOI: 10.1055/s-0042-1742609
Abstract
Pseudoprogression refers to the initial apparent increase in tumor burden observed on imaging after cancer therapy, with subsequent delayed response to the same treatment, thus giving a false initial appearance of disease progression. It is essential to differentiate pseudoprogression from true progression to prevent the patients from getting deprived of the benefits of their ongoing cancer therapy owing to their early withdrawal. It also affects their recruitment for clinical trials. Pseudoprogression, albeit uncommon, has been observed after various types of cancer therapy; however, this phenomenon has gained momentum of late due to the emergence of immunotherapy for the treatment of various malignancies. Besides immunotherapy, pseudoprogression has predominantly been of concern in a few patients after radiation therapy for brain tumors and metastasis, after molecular targeted therapy for a variety of tumors, and after chemotherapy in metastatic bone lesions. This article reviews the available data on imaging of pseudoprogression from various types of cancer therapies, highlighting ways to suspect or identify it on imaging.
Contributions of Each Author
N.C. contributed to the concept, design, definition of intellectual content, literature search, and manuscript preparation. A.M. contributed to manuscript editing and manuscript review. A.D.B. contributed to manuscript review. A.C. contributed to manuscript review. V.P. contributed to manuscript review. P.P. contributed to manuscript review. H.U. contributed to manuscript review.
The manuscript has been read and approved by all the authors and the requirements for authorship have been met, and each author believes that the manuscript represents honest work.
Publication History
Article published online:
14 February 2022
© 2022. Indian Society of Medical and Paediatric Oncology. This is an open access article published by Thieme under the terms of the Creative Commons Attribution-NonDerivative-NonCommercial License, permitting copying and reproduction so long as the original work is given appropriate credit. Contents may not be used for commercial purposes, or adapted, remixed, transformed or built upon. (https://creativecommons.org/licenses/by-nc-nd/4.0/)
Thieme Medical and Scientific Publishers Pvt. Ltd.
A-12, 2nd Floor, Sector 2, Noida-201301 UP, India
Abstract
Pseudoprogression refers to the initial apparent increase in tumor burden observed on imaging after cancer therapy, with subsequent delayed response to the same treatment, thus giving a false initial appearance of disease progression. It is essential to differentiate pseudoprogression from true progression to prevent the patients from getting deprived of the benefits of their ongoing cancer therapy owing to their early withdrawal. It also affects their recruitment for clinical trials. Pseudoprogression, albeit uncommon, has been observed after various types of cancer therapy; however, this phenomenon has gained momentum of late due to the emergence of immunotherapy for the treatment of various malignancies. Besides immunotherapy, pseudoprogression has predominantly been of concern in a few patients after radiation therapy for brain tumors and metastasis, after molecular targeted therapy for a variety of tumors, and after chemotherapy in metastatic bone lesions. This article reviews the available data on imaging of pseudoprogression from various types of cancer therapies, highlighting ways to suspect or identify it on imaging.
Introduction
Imaging plays a vital role in response assessment after the administration of cancer therapy of any type, based on which, the further line of management is decided upon. There has been significant progress in the field of precision medicine. Unfortunately, the response evaluation criteria have not been able to keep pace with it. Pseudoprogression, as the name suggests, refers to an initial appearance of disease progression on post-therapy imaging, which later on responds during the same treatment.[1]
Pseudoprogression has primarily been known to be associated with radiotherapy for brain tumors, the incidence ranging from 5.5 to 31%.[2] With the advent of recent cancer therapies, pseudoprogression has also been observed in these instances: after immunotherapy during clinical trials; up to 10%-incidence in melanoma and 5% incidence in advanced non-small cell lung cancer (NSCLC), after molecular targeted therapy in a variety of tumors; and predominantly in gastrointestinal stromal tumor (GIST), after stereotactic radiosurgery (SRS) and/or stereotactic radiotherapy (SRT) for brain metastasis and after chemotherapy in metastatic bone lesions.[3] [4] [5] The decision to continue or withdraw the ongoing therapy depends on the post-therapy response assessment on imaging. Inability to suspect or identify pseudoprogression on imaging could lead to some patients getting deprived of the ongoing effective cancer therapy due to its early withdrawal and it would also affect recruitment for clinical trials.[1]
This article will help to recognize pseudoprogression and guide its subsequent management.
Definition of Pseudoprogression
Pseudoprogression refers to the initial appearance of increased tumor burden on imaging following cancer therapy, which regresses on follow-up, suggesting a response to the same therapy.[1]
The increased tumor burden could be in the form of:
-
increase in tumor size or
-
emergence of new lesions, whether measurable or non-measurable.[1]
In the case of brain metastasis/tumor, there may be an initial increase in contrast-enhancing areas post-radiotherapy which subsides with time, giving the false appearance of tumor progression.[5]
Types of Post-Treatment Response Evaluation Criteria
[Table 1] enlists the different types of response evaluation criteria after various cancer therapies with their respective applications and limitations.
|
Type of criteria |
Applications and key features |
Limitations (if any) |
References |
|---|---|---|---|
|
World Health Organization criteria |
-Morphology-based conventional tumor response criteria after cytotoxic chemotherapy. -Requires bidimensional measurement. |
-No mention regarding the minimum size of the lesion to be considered for measurement and the number of lesions to be measured. -Bidimensional measurement of lesion inaccurate. |
|
|
Response evaluation criteria in solid tumors (RECIST) 1.0 |
-Morphology-based conventional tumor response criteria after cytotoxic chemotherapy. -Requires unidimensional measurement. |
-MRI and MDCT could not be incorporated for response evaluation, only spiral CT could be used. -Lymph nodes were not included for response evaluation. |
|
|
RECIST 1.1 |
-Morphology-based conventional tumor response criteria after cytotoxic chemotherapy. -Requires unidimensional measurement. -Both MRI and multidetector CT (MDCT) can be incorporated for response evaluation. -Lymph nodes included for response evaluation. |
Inaccurate response evaluation post-immunotherapy and post-molecular targeted therapy leads to premature discontinuation of therapy. |
|
|
Immune-related response criteria |
-Post-immunotherapy (cytostatic) response criteria. -Requires bidimensional measurement. -Requires confirmation of progressive disease (PD) on a follow-up scan after at least 4 weeks, meanwhile continuing the ongoing immunotherapy. -Measurement of new lesion included in the sum of the target lesion. |
Variability in response due to bidimensional usage of measurement. |
|
|
irRECIST |
-Post-immunotherapy (cytostatic) response criteria. -Requires unidimensional measurement. -Requires confirmation of PD on a follow-up scan after at least 4 weeks, meanwhile continuing the ongoing immunotherapy. -Measurement of new lesion included in the sum of the target lesion. |
-The term unconfirmed PD (iUPD) is not included. -New lesion not separately defined |
|
|
iRECIST |
-Post-immunotherapy (cytostatic) response criteria. -Both CT and MRI can be used for evaluation. -Requires unidimensional measurement. -New lesions recorded separately. -Defines “unconfirmed progressive disease (iUPD)” which needs to be confirmed on a follow-up scan after 4–8 weeks. -Mentioning iUPD allows the patient to either continue with the ongoing immunotherapy till PD is confirmed on a follow-up scan or change the treatment regimen owing to side effects of ongoing therapy. |
||
|
Positron Emission Tomography Response Criteria in Solid Tumors (PERCIST) |
-PET-CT-based criteria for post-treatment evaluation of solid tumors. -Based on tumor viability. -Bone metastasis can also be evaluated. |
-Requires follow-up on the same scanner for comparability. -Increased cost. -Pseudoprogression post-immunotherapy cannot be differentiated from true progression as uptake seen in both the conditions. |
|
|
Choi criteria |
-Initially used for post-treatment assessment of gastrointestinal stromal tumors (GIST). -Now used for assessment of any tumor treated with molecular targeted therapy. -Size or attenuation criteria used for evaluation. -Contrast-enhanced CT (CECT)-based criteria. |
Post-treatment hemorrhage can increase attenuation within the lesion and mimic tumor progression. |
|
|
Revised Choi criteria |
-For evaluation of any tumor treated with molecular targeted therapy. -Better correlation with the clinical outcome than Choi criteria -Concurrent use of size and attenuation criteria. -CECT-based criteria |
Post-treatment hemorrhage can increase attenuation within the lesion and mimic tumor progression. |
[13] |
|
Size and attenuation of CT (SACT) criteria |
Assessment of any tumor treated with antiangiogenic agents. |
Hemorrhage within a lesion can increase attenuation within the lesion and mimic unfavorable response. |
|
|
Mass, attenuation, size, and structure (MASS) criteria |
-Assessment of any tumor treated with antiangiogenic agents -CECT-based criteria |
-Complex parameters for response assessment may limit routine clinical use. -Hemorrhage within a lesion can increase attenuation within the lesion and mimic unfavorable response. |
|
|
Response assessment in neuro-Oncology (RANO) criteria |
-MRI-based criteria for post-treatment assessment of brain tumors mainly in clinical trials. -RANO brain metastasis (BM), predominantly MRI-based criteria for evaluation of brain metastasis. Mainly used in clinical trials but can also be routinely used. |
Does not differentiate pseudoprogression and radiation necrosis from true progression as perfusion studies are not included in the criteria. |
|
|
MD Anderson criteria |
-For post-chemotherapy evaluation of bone metastasis without a soft tissue component. -Either radiograph, CT, MRI or skeletal scintigraphy can be used. |
[18] |
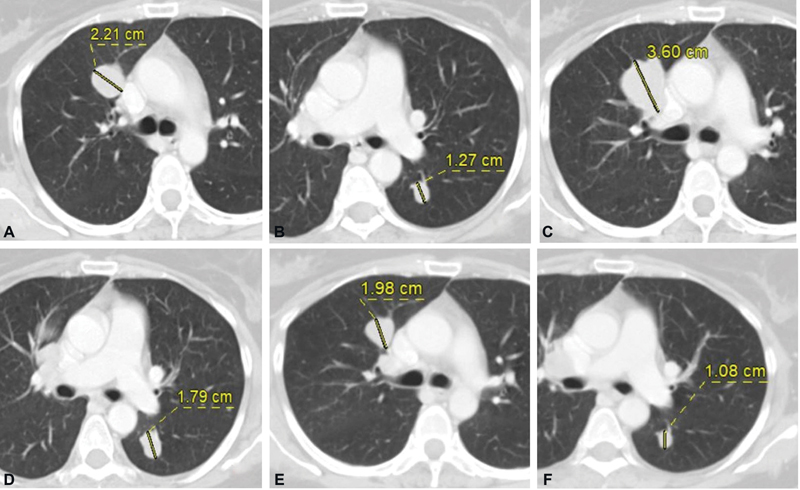
| Fig. 1(A) Metastatic right upper lobe perihilar nodule and (B) left lower lobe nodule at baseline CT. (C and D) Increase in size of these nodules after immunotherapy and decrease in size on follow-up scan (E and F).
Pseudoprogression Post-Molecular Targeted Therapy
There are a variety of molecular targeted therapies, of which, response to an antiangiogenic agent has, in particular, been known to mimic disease progression. The mechanism of action of the antiangiogenic agent is the vascular endothelial growth factor pathway-mediated inhibition of angiogenesis in cancer cells.[4] Pseudoprogression after molecular targeted therapy is most commonly seen in GIST.
Evaluation on Imaging
Post-antiangiogenic treatment, the tumor shows a decrease in solid enhancing components and an increase in necrosis due to a reduction in vascularity.[4] Increase in necrosis can sometimes lead to an increase in size which gives the appearance of tumor progression.[4] Hence, modified Choi criteria is a better predictor of response after antiangiogenic molecular targeted therapy, which is based on the tumor size and CT density, than RECIST 1.1, which solely relies on size criteria.[13] However, post-treatment hemorrhage can also give rise to increased CT attenuation and thus mimic pseudoprogression even on modified Choi criteria. Decrease in the solid enhancing components despite increase in size suggests pseudoprogression.[13] Besides this, isodense liver metastases, which are invisible on the baseline scan, can become conspicuous on post-antiangiogenic therapy due to reduction in their vascularity, thus making them stand out against the backdrop of enhancing liver parenchyma, giving a pseudoappearance of new-onset liver lesions.[4] Disappearance or regression of these liver lesions after 4 weeks follow-up scan suggests pseudoprogression.[4]
[Fig. 2(A–C)] shows pseudoprogression in a case of GIST after molecular targeted therapy.
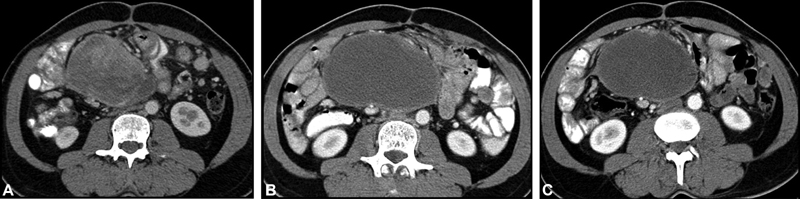
| Fig.2:(A) Heterogeneously enhancing solid components within mesenteric GIST at baseline CT. (B) Increase in size but significant decrease in enhancing components after molecular targeted therapy. (C) Mild decrease in size with no obvious enhancing component on follow-up. GIST, gastrointestinal stromal
Pseudoprogression of Brain Tumor and Metastasis after Radiotherapy
Pseudoprogression has primarily been known to be associated with radiotherapy for brain tumors but has also been seen after SRS and/or SRT for brain metastasis.[5] Its incidence is, however, much higher after combining radiotherapy with temozolomide (chemotherapy) for brain tumors.[16] [24] [25] Hypermethylated O6-methylguanine-DNA-methyltransferase are often associated with post-treatment pseudoprogression.[26] [27] Pseudoprogression is seen within a few weeks to 3 months of starting radiotherapy.[5] The time frame is important to differentiate it from radiation necrosis which occurs after 3 months of starting radiotherapy.[5] Radiation injury to oligodendrocytes causes temporary cessation of myelin synthesis resulting in pseudoprogression.[5] Pseudoprogression is thought to be due to transient disruption in the blood–brain barrier with resultant edema and contrast enhancement.[5]
Evaluation on Imaging
Pseudoprogression is seen as an initial increase in the contrast-enhancing area after radiotherapy or combined chemoradiotherapy which subsides with time.[24] Response assessment in neuro-oncology criteria used for brain tumor response assessment on magnetic resonance imaging (MRI) post-therapy cannot help to differentiate pseudoprogression from true progression.[16] Imaging features cannot differentiate between pseudoprogression and radiation necrosis, the differentiation is entirely based on the time frame.[5] Diffusion-weighted imaging, diffusion tensor imaging, dynamic susceptibility contrast enhancement MR perfusion, and dynamic contrast-enhanced MRI perfusion have been used to differentiate post-treatment change from recurrence.[5] [16] [24] [28] [Table 2] highlights the differentiating features of pseudoprogression from tumor recurrence/metastasis.[5]
|
Imaging modality |
Pseudoprogression |
Tumor recurrence/metastasis |
|---|---|---|
|
DWI/ADC |
No restricted diffusion/higher ADC values |
Restricted diffusion/lower ADC values |
|
DTI |
Low FA |
High FA |
|
DCE-MRI perfusion |
Reduced CBV <2> |
Increased CBV >2 mL/100 g |
|
LQ (Lesion quotient) = Area of T2 hypointense nodule/ area of contrast-enhanced T1WI. |
< 0.3 |
> 0.6 |
|
PET/SPECT |
Decreased metabolic activity/decreased radiotracer uptake |
Increased metabolic activity/increased radiotracer uptake |
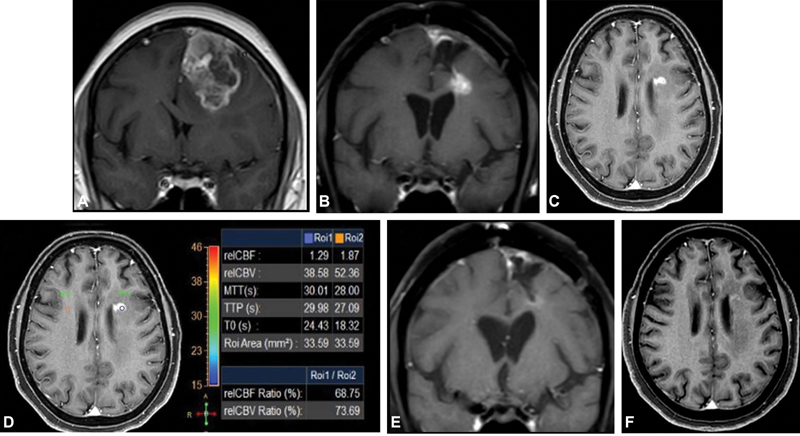
| Figure.3:(A) Left frontal lobe GBM at baseline MRI. (B and C) New enhancing nodule on post-surgery EBRT and adjuvant TMZ in left periventricular white matter showing hypoperfusion (D). Decrease in enhancement on follow-up (E and F). EBRT, external beam radiation therapy; GBM, glioblastoma multiforme; TMZ,
temozolomide.
Pseudoprogression of Bone Metastasis Post-Chemotherapy
Bone metastasis is a tricky area for evaluation. Bone metastasis is considered as a non-measurable disease unless associated with a soft tissue component, which then becomes measurable as per RECIST 1.1 criteria. MD Anderson criteria are used for evaluating bone metastasis. As per MD Anderson criteria, complete or partial sclerotic fill-in of a prior lytic lesion is considered as a complete or partial response to treatment, respectively.[18] Post-treatment osteoblastic flare is a known phenomenon; hence, sclerotic bone lesions should be viewed with caution. Osteoblastic flare phenomenon refers to the appearance of sclerosis in a lytic bone lesion or an increase in the extent of an existing sclerotic bone lesion due to post-treatment healing.[18]
Response Evaluation on CT Scan
-
Appearance of a new sclerotic bone lesion with partial response (sclerosis) of previously seen lytic bone lesions elsewhere should be considered as pseudoprogression as it most likely represents the post-treatment osteoblastic flare phenomenon.[18]
-
Increase in the size of a sclerotic bone lesion should also be considered as pseudoprogression due to the post-treatment osteoblastic flare phenomenon. PET-CT can help in the evaluation of skeletal metastasis.[12] [29] Osteoblastic flare phenomenon should be followed up for 6 months or more for confirmation as it would eventually show a decrease in uptake on fluorodeoxyglucose-positron emission tomography (FDG-PET) scan after 2 to 3 months. A continued increase in the number and intensity of uptake of bone lesions beyond 6 months should be considered as disease progression.[18]
-
Appearance of a new sclerotic bone lesion without any prior documentation of bone metastasis should be considered as a true progression only if it is confirmed on bone scan/FDG-PET/MRI as it could possibly be due to its inconspicuity in the previous CT scan with post-treatment healing leading to its visibility in the present scan.[18]
-
Additional Points to Remember
-
Besides bone metastasis, pseudoprogression can also be seen at other sites after conventional chemotherapy either due to decreased vascularity or hemorrhage, so one must watch out for it after conventional chemotherapy as well.[18]
-
“Hyperprogression” refers to more than two-fold increase in the pace of tumor progression after starting immunotherapy, and it is associated with worse outcomes. Pseudoprogression, on the contrary, is associated with increased survival. So, clinical condition of the patient is important in differentiating pseudoprogression from hyperprogression.[21]
Conclusion
Pseudoprogression, albeit uncommon, can deprive the patient of ongoing treatment, if not correctly identified. Response on follow-up scan is the key to identifying it post-immunotherapy unless the patient deteriorates on therapy, which points toward true progression. Knowledge of the mechanism of action is important for identifying pseudoprogression post-antiangiogenic molecular targeted therapy and after chemotherapy for bone metastasis, whereas, multiparametric MRI and time frame help to identify pseudoprogression of brain tumor/metastasis post-radiotherapy.
Conflict of Interest
None declared.
Contributions of Each Author
N.C. contributed to the concept, design, definition of intellectual content, literature search, and manuscript preparation. A.M. contributed to manuscript editing and manuscript review. A.D.B. contributed to manuscript review. A.C. contributed to manuscript review. V.P. contributed to manuscript review. P.P. contributed to manuscript review. H.U. contributed to manuscript review.
The manuscript has been read and approved by all the authors and the requirements for authorship have been met, and each author believes that the manuscript represents honest work.
References
- Ma Y, Wang Q, Dong Q, Zhan L, Zhang J. How to differentiate pseudoprogression from true progression in cancer patients treated with immunotherapy. Am J Cancer Res 2019; 9 (08) 1546-1553
- Hygino da Cruz Jr LC, Rodriguez I, Domingues RC, Gasparetto EL, Sorensen AG. Pseudoprogression and pseudoresponse: imaging challenges in the assessment of posttreatment glioma. AJNR Am J Neuroradiol 2011; 32 (11) 1978-1985
- Nishino M, Hatabu H, Hodi FS. Imaging of cancer immunotherapy: current approaches and future directions. Radiology 2019; 290 (01) 9-22
- Tirumani SH, Fairchild A, Krajewski KM. et al. Anti-VEGF molecular targeted therapies in common solid malignancies: comprehensive update for radiologists. Radiographics 2015; 35 (02) 455-474
- Parvez K, Parvez A, Zadeh G. The diagnosis and treatment of pseudoprogression, radiation necrosis and brain tumor recurrence. Int J Mol Sci 2014; 15 (07) 11832-11846
- Borcoman E, Nandikolla A, Long G, Goel S, Le Tourneau C. Patterns of response and progression to immunotherapy. Am Soc Clin Oncol Educ Book 2018; 38 (38) 169-178
- Persigehl T, Lennartz S, Schwartz LH. iRECIST: how to do it. Cancer Imaging 2020; 20 (01) 2
- Tirkes T, Hollar MA, Tann M, Kohli MD, Akisik F, Sandrasegaran K. Response criteria in oncologic imaging: review of traditional and new criteria. Radiographics 2013; 33 (05) 1323-1341
- Chalian H, Töre HG, Horowitz JM, Salem R, Miller FH, Yaghmai V. Radiologic assessment of response to therapy: comparison of RECIST Versions 1.1 and 1.0. Radiographics 2011; 31 (07) 2093-2105
- Vancini C, De Falco Alfano D, Abousiam RN. et al. Comparison of radiological criteria (RECIST-MASS-SACT-Choi) in antiangiogenic therapy of renal cell carcinoma. Univers J Public Health 2016; 4 (05) 239-243
- Aide N, Hicks RJ, Le Tourneau C, Lheureux S, Fanti S, Lopci E. FDG PET/CT for assessing tumour response to immunotherapy: report on the EANM symposium on immune modulation and recent review of the literature. Eur J Nucl Med Mol Imaging 2019; 46 (01) 238-250
- Dhingra VK, Mahajan A, Basu S. Emerging clinical applications of PET based molecular imaging in oncology: the promising future potential for evolving personalized cancer care. Indian J Radiol Imaging 2015; 25 (04) 332-341
- Thian Y, Gutzeit A, Koh D-M. et al. Revised Choi imaging criteria correlate with clinical outcomes in patients with metastatic renal cell carcinoma treated with sunitinib. Radiology 2014; 273 (02) 452-461
- Smith AD, Lieber ML, Shah SN. Assessing tumor response and detecting recurrence in metastatic renal cell carcinoma on targeted therapy: importance of size and attenuation on contrast-enhanced CT. AJR Am J Roentgenol 2010; 194 (01) 157-165
- Smith AD, Shah SN, Rini BI, Lieber ML, Remer EM. Morphology, attenuation, size, and structure (MASS) criteria: assessing response and predicting clinical outcome in metastatic renal cell carcinoma on antiangiogenic targeted therapy. AJR Am J Roentgenol 2010; 194 (06) 1470-1478
- Leao DJ, Craig PG, Godoy LF, Leite CC, Policeni B. Response assessment in neuro-oncology criteria for gliomas: practical approach using conventional and advanced techniques. AJNR Am J Neuroradiol 2020; 41 (01) 10-20
- Chukwueke UN, Wen PY. Use of the response assessment in neuro-oncology (RANO) criteria in clinical trials and clinical practice. CNS Oncol 2019; 8 (01) CNS28
- Costelloe CM, Chuang HH, Madewell JE, Ueno NT. Cancer response criteria and bone metastases: RECIST 1.1, MDA and PERCIST. J Cancer 2010; 1: 80-92
- Borcoman E, Kanjanapan Y, Champiat S. et al. Novel patterns of response under immunotherapy. Ann Oncol 2019; 30 (03) 385-396
- Gong J, Chehrazi-Raffle A, Reddi S, Salgia R. Development of PD-1 and PD-L1 inhibitors as a form of cancer immunotherapy: a comprehensive review of registration trials and future considerations. J Immunother Cancer 2018; 6 (01) 8
- Onesti CE, Frères P, Jerusalem G. Atypical patterns of response to immune checkpoint inhibitors: interpreting pseudoprogression and hyperprogression in decision making for patients' treatment. J Thorac Dis 2019; 11 (01) 35-38
- Dromain C, Beigelman C, Pozzessere C, Duran R, Digklia A. Imaging of tumour response to immunotherapy. Eur Radiol Exp 2020; 4 (01) 2
- Anwar H, Sachpekidis C, Winkler J. et al. Absolute number of new lesions on 18F-FDG PET/CT is more predictive of clinical response than SUV changes in metastatic melanoma patients receiving ipilimumab. Eur J Nucl Med Mol Imaging 2018; 45 (03) 376-383
- Fatterpekar GM, Galheigo D, Narayana A, Johnson G, Knopp E. Treatment-related change versus tumor recurrence in high-grade gliomas: a diagnostic conundrum—use of dynamic susceptibility contrast-enhanced (DSC) perfusion MRI. AJR Am J Roentgenol 2012; 198 (01) 19-26
- ;Brandsma D, Stalpers L, Taal W, Sminia P, van den Bent MJ. Clinical features, mechanisms, and management of pseudoprogression in malignant gliomas. Lancet Oncol 2008; 9 (05) 453-461
- Brandes AA, Franceschi E, Tosoni A. et al. MGMT promoter methylation status can predict the incidence and outcome of pseudoprogression after concomitant radiochemotherapy in newly diagnosed glioblastoma patients. J Clin Oncol 2008; 26 (13) 2192-2197
- Seow P, Wong JHD, Ahmad-Annuar A, Mahajan A, Abdullah NA, Ramli N. Quantitative magnetic resonance imaging and radiogenomic biomarkers for glioma characterisation: a systematic review. Br J Radiol 2018; 91 (1092): 20170930
- Mahajan A, Deshpande SS, Thakur MH. Diffusion magnetic resonance imaging: a molecular imaging tool caught between hope, hype and the real world of “personalized oncology”. World J Radiol 2017; 9 (06) 253-268
- Mahajan A, Azad GK, Cook GJ. PET imaging of skeletal metastases and its role in personalizing further management. PET Clin 2016; 11 (03) 305-318
Address for correspondence
Publication History
Article published online:
14 February 2022
© 2022. Indian Society of Medical and Paediatric Oncology. This is an open access article published by Thieme under the terms of the Creative Commons Attribution-NonDerivative-NonCommercial License, permitting copying and reproduction so long as the original work is given appropriate credit. Contents may not be used for commercial purposes, or adapted, remixed, transformed or built upon. (https://creativecommons.org/licenses/by-nc-nd/4.0/)
Thieme Medical and Scientific Publishers Pvt. Ltd.
A-12, 2nd Floor, Sector 2,
Noida-201301 UP, India
| Fig. 1(A) Metastatic right upper lobe perihilar nodule and (B) left lower lobe nodule at baseline CT. (C and D) Increase in size of these nodules after immunotherapy and decrease in size on follow-up scan (E and F).
| Fig.2:(A) Heterogeneously enhancing solid components within mesenteric GIST at baseline CT. (B) Increase in size but significant decrease in enhancing components after molecular targeted therapy. (C) Mild decrease in size with no obvious enhancing component on follow-up. GIST, gastrointestinal stromal
| Figure.3:(A) Left frontal lobe GBM at baseline MRI. (B and C) New enhancing nodule on post-surgery EBRT and adjuvant TMZ in left periventricular white matter showing hypoperfusion (D). Decrease in enhancement on follow-up (E and F). EBRT, external beam radiation therapy; GBM, glioblastoma multiforme; TMZ, temozolomide.
References
- Ma Y, Wang Q, Dong Q, Zhan L, Zhang J. How to differentiate pseudoprogression from true progression in cancer patients treated with immunotherapy. Am J Cancer Res 2019; 9 (08) 1546-1553
- Hygino da Cruz Jr LC, Rodriguez I, Domingues RC, Gasparetto EL, Sorensen AG. Pseudoprogression and pseudoresponse: imaging challenges in the assessment of posttreatment glioma. AJNR Am J Neuroradiol 2011; 32 (11) 1978-1985
- Nishino M, Hatabu H, Hodi FS. Imaging of cancer immunotherapy: current approaches and future directions. Radiology 2019; 290 (01) 9-22
- Tirumani SH, Fairchild A, Krajewski KM. et al. Anti-VEGF molecular targeted therapies in common solid malignancies: comprehensive update for radiologists. Radiographics 2015; 35 (02) 455-474
- Parvez K, Parvez A, Zadeh G. The diagnosis and treatment of pseudoprogression, radiation necrosis and brain tumor recurrence. Int J Mol Sci 2014; 15 (07) 11832-11846
- Borcoman E, Nandikolla A, Long G, Goel S, Le Tourneau C. Patterns of response and progression to immunotherapy. Am Soc Clin Oncol Educ Book 2018; 38 (38) 169-178
- Persigehl T, Lennartz S, Schwartz LH. iRECIST: how to do it. Cancer Imaging 2020; 20 (01) 2
- Tirkes T, Hollar MA, Tann M, Kohli MD, Akisik F, Sandrasegaran K. Response criteria in oncologic imaging: review of traditional and new criteria. Radiographics 2013; 33 (05) 1323-1341
- Chalian H, Töre HG, Horowitz JM, Salem R, Miller FH, Yaghmai V. Radiologic assessment of response to therapy: comparison of RECIST Versions 1.1 and 1.0. Radiographics 2011; 31 (07) 2093-2105
- Vancini C, De Falco Alfano D, Abousiam RN. et al. Comparison of radiological criteria (RECIST-MASS-SACT-Choi) in antiangiogenic therapy of renal cell carcinoma. Univers J Public Health 2016; 4 (05) 239-243
- Aide N, Hicks RJ, Le Tourneau C, Lheureux S, Fanti S, Lopci E. FDG PET/CT for assessing tumour response to immunotherapy: report on the EANM symposium on immune modulation and recent review of the literature. Eur J Nucl Med Mol Imaging 2019; 46 (01) 238-250
- Dhingra VK, Mahajan A, Basu S. Emerging clinical applications of PET based molecular imaging in oncology: the promising future potential for evolving personalized cancer care. Indian J Radiol Imaging 2015; 25 (04) 332-341
- Thian Y, Gutzeit A, Koh D-M. et al. Revised Choi imaging criteria correlate with clinical outcomes in patients with metastatic renal cell carcinoma treated with sunitinib. Radiology 2014; 273 (02) 452-461
- Smith AD, Lieber ML, Shah SN. Assessing tumor response and detecting recurrence in metastatic renal cell carcinoma on targeted therapy: importance of size and attenuation on contrast-enhanced CT. AJR Am J Roentgenol 2010; 194 (01) 157-165
- Smith AD, Shah SN, Rini BI, Lieber ML, Remer EM. Morphology, attenuation, size, and structure (MASS) criteria: assessing response and predicting clinical outcome in metastatic renal cell carcinoma on antiangiogenic targeted therapy. AJR Am J Roentgenol 2010; 194 (06) 1470-1478
- Leao DJ, Craig PG, Godoy LF, Leite CC, Policeni B. Response assessment in neuro-oncology criteria for gliomas: practical approach using conventional and advanced techniques. AJNR Am J Neuroradiol 2020; 41 (01) 10-20
- Chukwueke UN, Wen PY. Use of the response assessment in neuro-oncology (RANO) criteria in clinical trials and clinical practice. CNS Oncol 2019; 8 (01) CNS28
- Costelloe CM, Chuang HH, Madewell JE, Ueno NT. Cancer response criteria and bone metastases: RECIST 1.1, MDA and PERCIST. J Cancer 2010; 1: 80-92
- Borcoman E, Kanjanapan Y, Champiat S. et al. Novel patterns of response under immunotherapy. Ann Oncol 2019; 30 (03) 385-396
- Gong J, Chehrazi-Raffle A, Reddi S, Salgia R. Development of PD-1 and PD-L1 inhibitors as a form of cancer immunotherapy: a comprehensive review of registration trials and future considerations. J Immunother Cancer 2018; 6 (01) 8
- Onesti CE, Frères P, Jerusalem G. Atypical patterns of response to immune checkpoint inhibitors: interpreting pseudoprogression and hyperprogression in decision making for patients' treatment. J Thorac Dis 2019; 11 (01) 35-38
- Dromain C, Beigelman C, Pozzessere C, Duran R, Digklia A. Imaging of tumour response to immunotherapy. Eur Radiol Exp 2020; 4 (01) 2
- Anwar H, Sachpekidis C, Winkler J. et al. Absolute number of new lesions on 18F-FDG PET/CT is more predictive of clinical response than SUV changes in metastatic melanoma patients receiving ipilimumab. Eur J Nucl Med Mol Imaging 2018; 45 (03) 376-383
- Fatterpekar GM, Galheigo D, Narayana A, Johnson G, Knopp E. Treatment-related change versus tumor recurrence in high-grade gliomas: a diagnostic conundrum—use of dynamic susceptibility contrast-enhanced (DSC) perfusion MRI. AJR Am J Roentgenol 2012; 198 (01) 19-26
- ;Brandsma D, Stalpers L, Taal W, Sminia P, van den Bent MJ. Clinical features, mechanisms, and management of pseudoprogression in malignant gliomas. Lancet Oncol 2008; 9 (05) 453-461
- Brandes AA, Franceschi E, Tosoni A. et al. MGMT promoter methylation status can predict the incidence and outcome of pseudoprogression after concomitant radiochemotherapy in newly diagnosed glioblastoma patients. J Clin Oncol 2008; 26 (13) 2192-2197
- Seow P, Wong JHD, Ahmad-Annuar A, Mahajan A, Abdullah NA, Ramli N. Quantitative magnetic resonance imaging and radiogenomic biomarkers for glioma characterisation: a systematic review. Br J Radiol 2018; 91 (1092): 20170930
- Mahajan A, Deshpande SS, Thakur MH. Diffusion magnetic resonance imaging: a molecular imaging tool caught between hope, hype and the real world of “personalized oncology”. World J Radiol 2017; 9 (06) 253-268
- Mahajan A, Azad GK, Cook GJ. PET imaging of skeletal metastases and its role in personalizing further management. PET Clin 2016; 11 (03) 305-318