 PDF
PDF  Views
Views  Share
Share


An Investigation of Bayes Algorithm and Neural Networks for Identifying the Breast Cancer
CC BY-NC-ND 4.0 · Indian J Med Paediatr Oncol 2017; 38(03): 340-344
DOI: DOI: 10.4103/ijmpo.ijmpo_127_17
Abstract
Context: Breast cancer is a biggest threat to women. X-ray mammography is the most effective method for early detection and screening of breast cancer. It is a tough challenge for the radiologist in reading mammography since it does not provide consistent result every time. Aim: To improve the primary sign of this disease, computer-aided diagnosis schemes have been developed. Using monitor, digital images of mammography are displayed and they can be lightened or darkened before they are printed on the film. Time factor is important to identify the abnormality in body such as breast cancer and lung cancer. Hence, to detect the tissues and treatment stages, image-processing techniques are improved in several medical areas. In this project, using low-level preprocessing techniques and image segmentation, the breast cancer detection is done. Methods: With the help of Bayes algorithm and neural networks (NNs), the type of the mammogram and stages is identified. For segmentation process, region-growing algorithm is used, which helps to find the affected portion, i.e., region of interest. Gray-level co-occurrence matrix (GLCM) and texture feature are used for feature extraction. Results: Bayes algorithm is used for probability of identification, whereas NNs is used to reduce the probability level from 0–1000 to 0–1 in case of classification.
Keywords
Artificial neural network - computer-aided diagnosis - gray-level co-occurrence matrix - mammogram - region of interestPublication History
Article published online:
04 July 2021
© 2017. Indian Society of Medical and Paediatric Oncology. This is an open access article published by Thieme under the terms of the Creative Commons Attribution-NonDerivative-NonCommercial-License, permitting copying and reproduction so long as the original work is given appropriate credit. Contents may not be used for commercial purposes, or adapted, remixed, transformed or built upon. (https://creativecommons.org/licenses/by-nc-nd/4.0/.)
Thieme Medical and Scientific Publishers Pvt. Ltd.
A-12, 2nd Floor, Sector 2, Noida-201301 UP, India
Abstract
Context:
Breast cancer is a biggest threat to women. X-ray mammography is the most effective method for early detection and screening of breast cancer. It is a tough challenge for the radiologist in reading mammography since it does not provide consistent result every time.
Aim:
To improve the primary sign of this disease, computer-aided diagnosis schemes have been developed. Using monitor, digital images of mammography are displayed and they can be lightened or darkened before they are printed on the film. Time factor is important to identify the abnormality in body such as breast cancer and lung cancer. Hence, to detect the tissues and treatment stages, image-processing techniques are improved in several medical areas. In this project, using low-level preprocessing techniques and image segmentation, the breast cancer detection is done.
Methods:
With the help of Bayes algorithm and neural networks (NNs), the type of the mammogram and stages is identified. For segmentation process, region-growing algorithm is used, which helps to find the affected portion, i.e., region of interest. Gray-level co-occurrence matrix (GLCM) and texture feature are used for feature extraction.
Results:
Bayes algorithm is used for probability of identification, whereas NNs is used to reduce the probability level from 0–1000 to 0–1 in case of classification.
Introduction
In worldwide, breast cancer is most commonly found in women. If the disease is found in early stages, it is curable. The causes of this disease are still unknown, hence primary prevention is impossible. The epidemiological factors such as early menarche and late menopause, family history, dietary, environmental factors, and genetic factors are the symptoms for the development of breast carcinoma.[1]
Mostly women are affected by the breast cancer, but men to get affected rarely. The major causes for women death are breast cancer. Early diagnostic techniques are improved for women's life quality. For screening and early diagnostic, the main test used in mammography which is convenient, inexpensive, and least choice in early detection of breast cancer. Most of the major changes of the breast cancer can be depicted by mammograms. Mass, spicular lesions, and calcification content are the primary radiography sign of cancer.[2,3]
Bayesian networks help to find the probabilistic relationship between findings and diseases. This project is about diagnosing breast diseases by mammography, with the help of radiological findings observed on mammography. To run the features extracted on a mass and features for the classification of lesions, selection is implemented. Two crucial points in the steps are method of data normality to be used with no assumption and physical meaning of each feature needed for preservation.
System Design
A set of features related to the geometry of boundary and structure inside it is computed once the mass boundary is identified called feature extraction. This is mainly used to simplify accurately the resource required to describe large set of data. The information from the original data and representing it in lower dimensionality space is done by features extraction[4,5] and the selection method.
Starting from the values of the ranked features classification procedures allows assigning a malignancy index to each detected mass. The area under the curve that is the area under the receiver operating characteristic curve is computed, by which validation of steps is performed.[6,7,8] An image is partitioned into distinct regions, containing that each pixel with similar attributes is done by segmentations. A simple region-based image segmentation method is region growing. Since it involves the selection of initial seed point's region, growing method is also classified as a pixel-based image segmentation method [Figure 1].
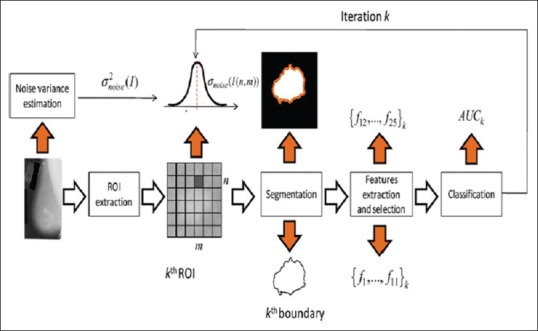
| Figure 1:Block diagram of proposed system
Neural networks
The family of statistical learning algorithms is neural network (NN) in machine learning and cognitive science, artificial NNs (ANNs) which are inspired by biological NNs. They are mostly used in estimation of functions which depends on a large numbers of unknown inputs. A system of interconnect “neurons” is generally presented by ANNs which can compute values from inputs and capable of machine learning as well as pattern recognition to their adaptive nature.
An information-processing paradigm is an ANN that is inspired by the way biological nervous system is processing brain information. The novel structure of the information-processing system is the key element of this paradigm. To solve the specific problems, a large number of highly interconnected elements work. Pattern recognition and data classification are the specific application for which ANN is configured done by through learning process. Learning involves adjustment to the synaptic connection that exists between the neurons in biological systems.
Bayes classifier
A simple technique for construction classifier is naive Bayes model which assigns class label to problem instance, represented as vectors of features values, where class label is drawn from finite set. It is family of algorithm based on the common principle, and all naive Bayes classifiers assume that the particular feature value is independent of the any other feature values of the class variables. For example, consider an apple, red, round, and diameter is 3”. The colors, roundness, and diameter features are independently contributed for a naive Bayes classifier. In practical application, parameter estimation for naive Bayes model uses the maximum method.
Only a small amount of training data are required to estimate the parameter necessary for classification which is the advantage of naive Bayes model. A family of simple probabilistic classifiers based on applying Bayes theorem with strong independent assumption between the features is done in machine learning. With more advanced methods including support vector machine,[9] this domain is found to be competitive, with appropriate preprocessing technique. An automatic medical diagnosis is one of its applications.


Results and Discussion
Input images
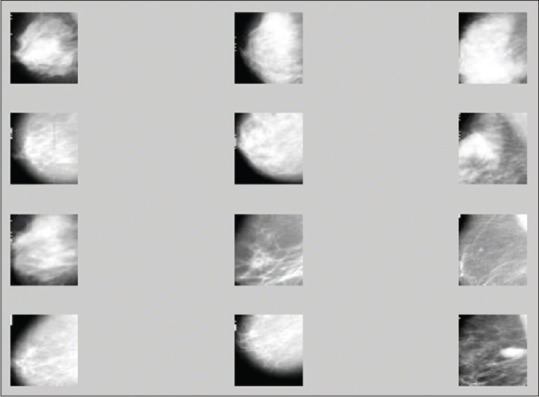
The image is used to find the image analysis techniques for extracting all the features from mammogram image to find the difference between normal and diseased samples. Then, the image is used to preprocessing stage. The removal of pepper and salt noise and conversion to gray scale is preprocessing.[10] The input image of mammogram is shown in Figure 2.

| Figure 2:Input images
Image enhancement
To enhance the input image, histogram equalization method is used. Histogram equalization harmonizes the image luminosity level distribution in that each of the histogram levels tends to increase the contrast level toward the same number of pixels. This is normally used to maximize the image luminance. Histogram equalization is a method in image processing of contrast adjustment using the image histogram. This method usually increases the global contrast of many images. The enhanced image is shown in Figure 3.
| Figure 3:Enhanced input images
Segmented images
Image segmentation is subdividing a digital image into many equal segments.[11] Image segmentation is typically used to locate objects and boundaries (lines, curves, etc.) in images, as shown in Figure 4. Region-growing algorithm is used to segment the affected region. It is done by considering the seed node and then comparing the neighboring pixels and growing the region according to it.
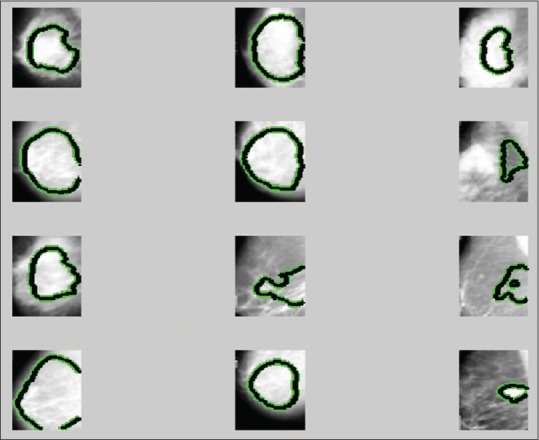
| Figure 4:Segmented images
Feature extraction
Feature extraction is used to extract the several features in an image.[12,13,14,15] It is very important to get information from original data and small dimensionality space, where the feature extraction of test image is shown in Figure 5.
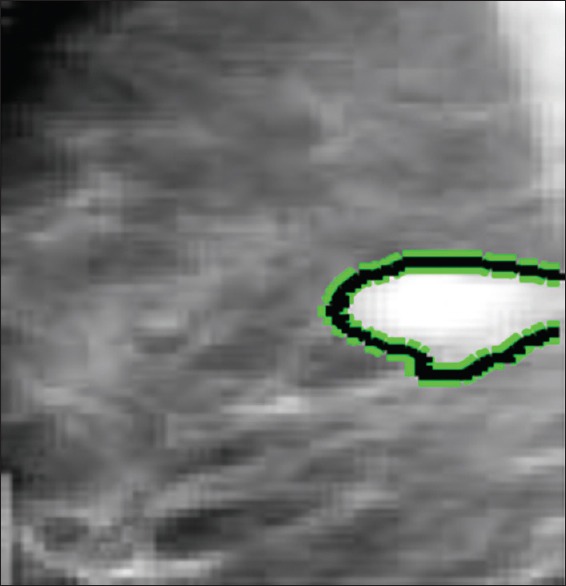
| Figure 5:Feature extraction of test image
Test images
The unknown samples of image are opened by MATLAB, as shown in Figure 6.
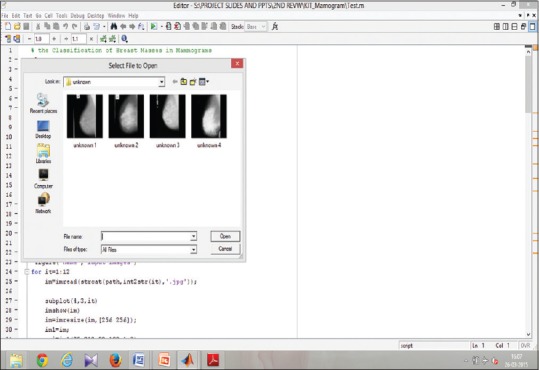
| Figure 6:Unknown samples
Classification
The image classification is that all pixels in a digital image are classified into several classes. The aim of this classification is to find a gray level, features produced in an image by object, or type of land to cover these features actually represent on the ground. Every image is classified according to its visual content. Bayes algorithm and NN are used as classifiers. The classification of unknown samples is shown in Figure 7.
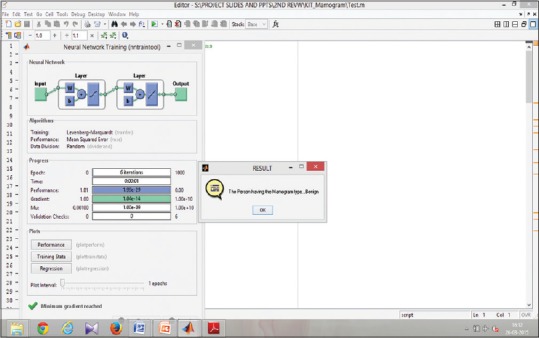
| Figure 7:Classification of unknown samples
Unknown samples for performance calculation
The unknown samples for performance calculation are shown in Figure 8.
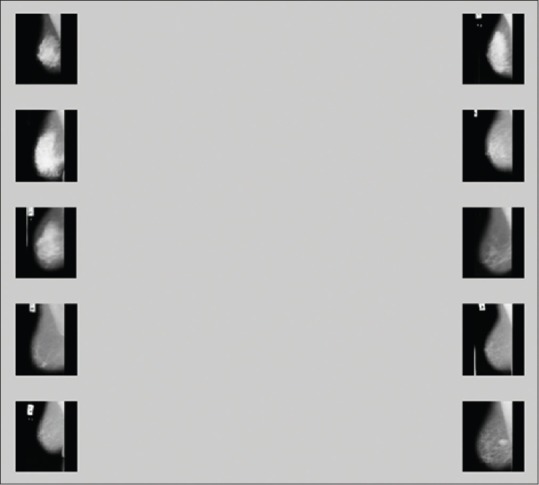
| Figure 8:Classification of unknown samples
Feature extraction of multiple samples
The input data are big and the data will be represented in reduced set of features. Transforming the input data into the set of features is called feature extraction. In this both, gray-level co-occurrence matrix and wavelet texture features are analyzed, as shown in Figure 9.
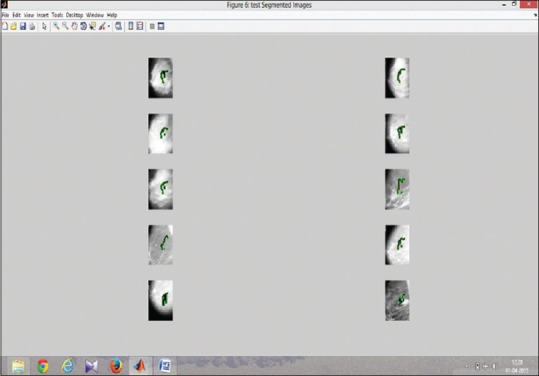
| Figure 9:Classification of unknown samples
Classification of multiple samples
The classification of multiple samples using NNs is shown in Figure 10.
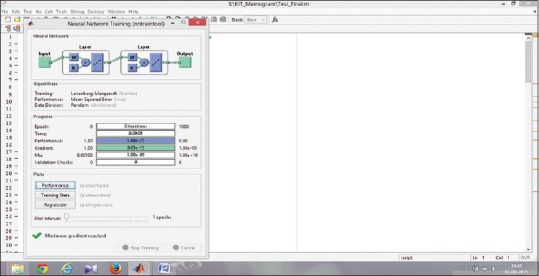
| Figure 10:Classification of multiple samples
Accuracy rate
The accuracy is nothing, but the items classified correctly\all items classified. It is the percentage of test set tuples that are correctly classified. It is the difference (subtract) between the accepted value and the experimental value, then divide by the accepted value. The bar chart of performance accuracy is shown in Figure 11.
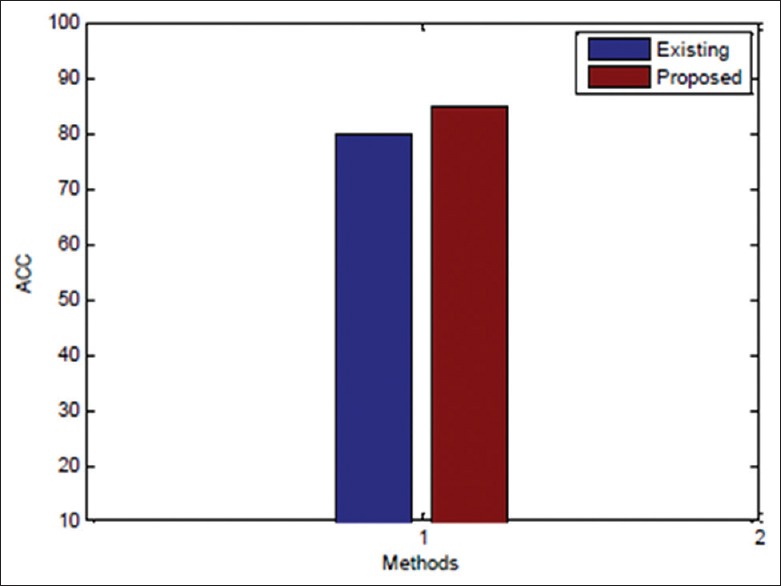
| Figure 11:Bar chart of performance accuracy
Error rate
The error rate is the comparison of existing and proposed methods, as shown in Figure 12. It is the calculation of error rate where the total numbers of unequal pairs of data elements are divided by one source of number of input data elements.
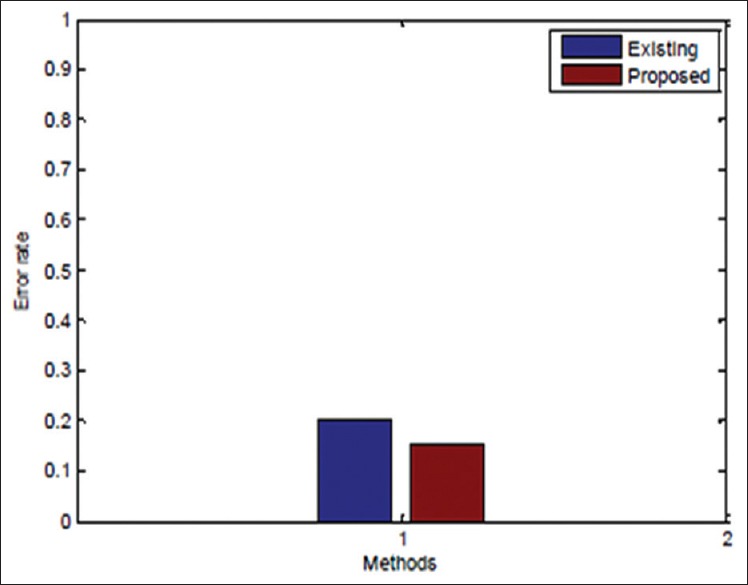
| Figure 12:Bar chart of performance error
Conclusion
The importance of knowing our health condition has increased with the development in science and technology, where mammogram plays a critical role. The identification of mammogram using Bayes algorithm and NN which helps to spot the lesions level and cancer stage is explained clearly in this project. The cancer with high accuracy can be found out the help of this module in less time. The main advantages of this module are that it reduces the wrong detection and reduces number of test to be taken in identification of cancer. The treatment can be done at the right time if the beginning stage of cancer is identified. Using wavelet texture feature in feature extraction, the accuracy level is increased. For this probability, Bayes algorithm is used. The analysis is made based on the performance of the project and result is improved.
Financial support and sponsorship
Nil.
Conflicts of interest
There are no conflicts of interest.
References
- Udayakumar E, Santhi S, Vetrivelan P. TB screening using SVM and CBC techniques. Curr Pediatr Res Allied Acad 2017;21:338-42.
- Udayakumar E, Vetrivelan P. PAPR reduction for OQAM/OFDM signals by using neural networks. Int J Appl Eng Res 2015;10:30292-7.
- Mencattini A, Salmeri M, Lojacono R, Frigerio M, Caselli F. Mammographic images enhancement and denoising for breast cancer detection using dyadic wavelet processing. IEEE Trans Instrum Meas 2008;6:1-12.
- Balleyguier C, Ayady S, Nguyen KV, Vanel D, Dromain C, Sigal R. BIRADS classification in mammography. Eur J Radiol 2007;61:192:4.
- Babbs CF, Liu S, Delp EJ. Multiresolution detection of speculated lesions in digital mammograms. IEEE Trans Image Process 2001;10:874-84.
- Guliato D, Rangayyan RM, Carvalho JD, Santiago SA. Polygonal modelling of contours of breast tumours with the preservation of spicules. IEEE Trans Biomed Eng 2008;55:14-20.
- Guliato D, Rangayyan RM, Carvalho JD, Santiago SA. Improving neural networks by preventing co-adaptation of feature detectors. IEEE Trans Image Process 2012;50:1-18.
- Gravel P, Beaudoin G, De Guise JA. A method for modeling noise in medical images. IEEE Trans Med Imaging 2004;23:1221-32.
- Mencattini A, Salmeri M, Caselli F, Sciunzi B, Lojacono R. Subband variance computation of homoscedastic additive noise in discrete dyadic wavelet transform. Int J Wavelets Multiresolut Inf Process 2008;6:1-12.
- Haralick R, Shanmugam K, Dinstein I. Textural features for image classification. IEEE Trans Syst Man Cybern 1973;3:610-21.
- Hanley JA, McNeil BJ. The meaning and use of the area under a receiver operating characteristic (ROC) curve. Radiology 1982;143:29-36.
- Mencattini A, Rabottino G, Salicone S, Salmeri M. Uncertainty modeling and propagation through rFVs for the assessment of CADx systems in digital mammography. IEEE Trans Instrum Meas 2010;59:27-38.
- Mohsin Jadoon M, Mohsin Jadoon M, Qianni Zhang, Ihsan Ul Haq, Adeel Jadoon, Abdul Basit, et al. Classification of mammograms for breast cancer detection based on curvelet transform and multi-layer perceptron. Biomed Res Allied Acad 2017; 28:4311-5.
- Yogadinesh S, Oswalt Manoj S, Srihari K, Rajesh S, Devendran N, Ayyaparaja K, et al. Certain investigation of identify the new rules and accuracy using SVM algorithm. Middle East J Sci Res 2015;23:2074-80.
- Udayakumar E, Santhi S, Gowrishankar R, Ramesh C, Gowthaman T. Region growing image segmentation for newborn brain MRI. Biotechnology: An Indian Journal Trade Sci Inc 2016;12:1-8.
| Figure 1:Block diagram of proposed system
| Figure 2:Input images
| Figure 3:Enhanced input images
| Figure 4:Segmented images
| Figure 5:Feature extraction of test image
| Figure 6:Unknown samples
| Figure 7:Classification of unknown samples
| Figure 8:Classification of unknown samples
| Figure 9:Classification of unknown samples
| Figure 10:Classification of multiple samples
| Figure 11:Bar chart of performance accuracy
| Figure 12:Bar chart of performance error
References
- Udayakumar E, Santhi S, Vetrivelan P. TB screening using SVM and CBC techniques. Curr Pediatr Res Allied Acad 2017;21:338-42.
- Udayakumar E, Vetrivelan P. PAPR reduction for OQAM/OFDM signals by using neural networks. Int J Appl Eng Res 2015;10:30292-7.
- Mencattini A, Salmeri M, Lojacono R, Frigerio M, Caselli F. Mammographic images enhancement and denoising for breast cancer detection using dyadic wavelet processing. IEEE Trans Instrum Meas 2008;6:1-12.
- Balleyguier C, Ayady S, Nguyen KV, Vanel D, Dromain C, Sigal R. BIRADS classification in mammography. Eur J Radiol 2007;61:192:4.
- Babbs CF, Liu S, Delp EJ. Multiresolution detection of speculated lesions in digital mammograms. IEEE Trans Image Process 2001;10:874-84.
- Guliato D, Rangayyan RM, Carvalho JD, Santiago SA. Polygonal modelling of contours of breast tumours with the preservation of spicules. IEEE Trans Biomed Eng 2008;55:14-20.
- Guliato D, Rangayyan RM, Carvalho JD, Santiago SA. Improving neural networks by preventing co-adaptation of feature detectors. IEEE Trans Image Process 2012;50:1-18.
- Gravel P, Beaudoin G, De Guise JA. A method for modeling noise in medical images. IEEE Trans Med Imaging 2004;23:1221-32.
- Mencattini A, Salmeri M, Caselli F, Sciunzi B, Lojacono R. Subband variance computation of homoscedastic additive noise in discrete dyadic wavelet transform. Int J Wavelets Multiresolut Inf Process 2008;6:1-12.
- Haralick R, Shanmugam K, Dinstein I. Textural features for image classification. IEEE Trans Syst Man Cybern 1973;3:610-21.
- Hanley JA, McNeil BJ. The meaning and use of the area under a receiver operating characteristic (ROC) curve. Radiology 1982;143:29-36.
- Mencattini A, Rabottino G, Salicone S, Salmeri M. Uncertainty modeling and propagation through rFVs for the assessment of CADx systems in digital mammography. IEEE Trans Instrum Meas 2010;59:27-38.
- Mohsin Jadoon M, Mohsin Jadoon M, Qianni Zhang, Ihsan Ul Haq, Adeel Jadoon, Abdul Basit, et al. Classification of mammograms for breast cancer detection based on curvelet transform and multi-layer perceptron. Biomed Res Allied Acad 2017; 28:4311-5.
- Yogadinesh S, Oswalt Manoj S, Srihari K, Rajesh S, Devendran N, Ayyaparaja K, et al. Certain investigation of identify the new rules and accuracy using SVM algorithm. Middle East J Sci Res 2015;23:2074-80.
- Udayakumar E, Santhi S, Gowrishankar R, Ramesh C, Gowthaman T. Region growing image segmentation for newborn brain MRI. Biotechnology: An Indian Journal Trade Sci Inc 2016;12:1-8.