 PDF
PDF  Views
Views  Share
Share


Analysis of TCGA (The Cancer Genome Atlas) Data for Prognosis, Risk Categorization, and Survival of AML Patients Using Bioinformatics
CC BY 4.0 · Indian J Med Paediatr Oncol 2025; 46(04): 384-396
DOI: DOI: 10.1055/s-0045-1804890
Abstract
Introduction Acute myeloid leukemia (AML) is a leading cause of mortality among Indian children and adults, driven by diverse genetic and epigenetic abnormalities. Limited access to genomic sequencing in India due to resource constraints has hindered a comprehensive understanding of prognostic factors specific to this population.
Objectives This study aims to analyze publicly available genomic data using statistical and bioinformatics tools to identify key prognostic markers relevant to Indian AML patients.
Materials and Methods The study utilized tumor/normal pair data from 200 adult de novo AML patients, obtained from The Cancer Genome Atlas (TCGA) and the Genotype-Tissue Expression database, analyzed using cBioPortal. Statistical and bioinformatics tools were employed to assess the impact of existing prognostic targets on disease response and to identify variables with clinical relevance and practical testing feasibility.
Results Analysis of the TCGA-AML data set identified high-frequency gene mutations (≥ 10%) and well-defined cytogenetic subtypes, including t(8;21)(q22;q22), NPM1 mutations, and CEBPA mutations as key factors for future prognostic evaluation. These findings will contribute to the development of a prognostic scoring system using R programming in future.
Conclusion This study offers insights into the cytogenetic and mutational landscape of AML in the Indian population, identifying critical genetic and cytogenetic markers with the potential to enhance prognostication, guide treatment strategies, and inform transplant decisions. Using R tools like limma and edgeR, differential expression analysis identified five key genes—NPM1, FLT3, IDH2, RUNX1, and STAG2—as significantly upregulated in AML. Notably, STAG2 emerges as a novel marker with potential prognostic significance, warranting validation in larger Indian cohorts. These findings may help uncover novel therapeutic targets not currently recognized in Western populations, paving the way for a more tailored and personalized approach to treatment in India. By leveraging global genomic databases, this research addresses regional gaps in knowledge. Future work should focus on validating these findings through large-scale studies in Indian cohorts to ensure their broader applicability and impact.
Keywords
bioinformatics - TCGA data - AML genetics - prognosis in AML - risk categorizationNote
The manuscript has been read and approved by all the authors and that each author believes that the manuscript represents honest work.
* Joint First authors.
# Joint corresponding authors.
Publication History
24 February 2025
© 2025. The Author(s). This is an open access article published by Thieme under the terms of the Creative Commons Attribution License, permitting unrestricted use, distribution, and reproduction so long as the original work is properly cited. (https://creativecommons.org/licenses/by/4.0/)
A-12, 2nd Floor, Sector 2, Noida-201301 UP, India
- Elevated HSPB1 Expression Is Associated with a Poor Prognosis in Glioblastoma Multiforme PatientsZhihua Wang, Journal of Neurological Surgery Part A: Central European Neurosurgery
- Mutations in Coagulation Factor VIII Are Associated with More Favorable Outcome in Patients with Cutaneous MelanomaJournal of Pediatric Biochemistry, 2017
- Prediction of the Survival Status, Immunotherapy Response, and Medication of Lung Adenocarcinoma Patients Based on Hypoxia- and Apoptosis-Related GenesZhiyue Shi, et al., Hormone and Metabolic Research, 2024
- Prospective Series of Nine Long Noncoding RNAs Associated with Survival of Patients with GlioblastomaBingxi Lei, Journal of Neurological Surgery Part A: Central European Neurosurgery, 2018
- Characteristics of Ovarian Cancer Immune Cell Invasion and Bioinformatics to Predict the Effect of ImmunotherapyLingli Yan, Hormone and Metabolic Research
- SOX11 as a potential prognostic biomarker in hepatocellular carcinoma linked to immune infiltration and ferroptosisChinese Journal of Cancer Research
- Zinc finger protein 296 promotes hepatocellular carcinoma progression via intervening interaction between macrophages and B cells<svg viewBox="0 0 24 24" fill="none" xmlns="http://www.w3.org/2000/svg">
</svg> Chinese Journal of Cancer Research - Analysis on tumor immune microenvironment and construction of a prognosis model for immune-related skin cutaneous melanoma<svg viewBox="0 0 24 24" fill="none" xmlns="http://www.w3.org/2000/svg">
</svg> WU Meng WANG Zheng ZHANG Jianglin, Journal of Central South University(Medical Science), 2023 - Unveiling clinical significance and tumor immune landscape of CXCL12 in bladder cancer: Insights from multiple omics analysisZhouting Tuo, Chinese Journal of Cancer Research, 2023
- Comparative analysis of tertiary lymphoid structures for predicting survival of colorectal cancer: a whole-slide images-based study<svg viewBox="0 0 24 24" fill="none" xmlns="http://www.w3.org/2000/svg">
</svg> Precision Clinical Medicine
Abstract
Introduction Acute myeloid leukemia (AML) is a leading cause of mortality among Indian children and adults, driven by diverse genetic and epigenetic abnormalities. Limited access to genomic sequencing in India due to resource constraints has hindered a comprehensive understanding of prognostic factors specific to this population.
Objectives This study aims to analyze publicly available genomic data using statistical and bioinformatics tools to identify key prognostic markers relevant to Indian AML patients.
Materials and Methods The study utilized tumor/normal pair data from 200 adult de novo AML patients, obtained from The Cancer Genome Atlas (TCGA) and the Genotype-Tissue Expression database, analyzed using cBioPortal. Statistical and bioinformatics tools were employed to assess the impact of existing prognostic targets on disease response and to identify variables with clinical relevance and practical testing feasibility.
Results Analysis of the TCGA-AML data set identified high-frequency gene mutations (≥ 10%) and well-defined cytogenetic subtypes, including t(8;21)(q22;q22), NPM1 mutations, and CEBPA mutations as key factors for future prognostic evaluation. These findings will contribute to the development of a prognostic scoring system using R programming in future.
Conclusion This study offers insights into the cytogenetic and mutational landscape of AML in the Indian population, identifying critical genetic and cytogenetic markers with the potential to enhance prognostication, guide treatment strategies, and inform transplant decisions. Using R tools like limma and edgeR, differential expression analysis identified five key genes—NPM1, FLT3, IDH2, RUNX1, and STAG2—as significantly upregulated in AML. Notably, STAG2 emerges as a novel marker with potential prognostic significance, warranting validation in larger Indian cohorts. These findings may help uncover novel therapeutic targets not currently recognized in Western populations, paving the way for a more tailored and personalized approach to treatment in India. By leveraging global genomic databases, this research addresses regional gaps in knowledge. Future work should focus on validating these findings through large-scale studies in Indian cohorts to ensure their broader applicability and impact.
Keywords
bioinformatics - TCGA data - AML genetics - prognosis in AML - risk categorizationIntroduction
Acute myeloid leukemia (AML) is a hematological malignancy that is driven by a complex interplay of diverse genetic and epigenetic abnormalities that disrupt normal blood cell development, thus causing high morbidity and mortality in both adults and children.
Risk stratification of AML using next-generation sequencing and genomic approach is often not feasible or available in Indian setup due to resource constraints. The entire repertoire of prognostic variables in Indian patients is less understood. The Cancer Genome Atlas (TCGA) data predominantly reflects outcomes from Western patients, whose ethnic backgrounds differ significantly from those of the Indian population. Also, the complex etiological factors that evolve into the mutational basis of disease and lead to progression are strikingly different due to geographic, racial, and biological differences. A genome-wide study on the Indian population is limited to a few groups due to limited resources and availability. This study aims to extrapolate these variables and analyze them into variables that can be tested economically and are feasible for Indian leukemia patients. The TCGA data was assessed and analyzed using statistical and bioinformatics analysis along with the existing AML database. The already established targets might have divergent outcomes, which can be validated in Indian patients if molecular testing is included in the scope of diagnosis. Diagnosis of AML is based on flow cytometry or immunophenotypes and there is a need to treat the underlying driving mutation as offered by newer Food and Drug Administration-approved targeted therapy. Multiple prognostic factors and patient variables make uniform treatment and management guidelines for AML difficult. The financial burden of AML care, including diagnosis and management, poses a significant challenge for most patients with limited resources. This research aims to identify the already existing prognostic variables and the gene mutation effects among Indian AML patients. Additionally, the study seeks to evaluate the applicability and relevance of the TCGA database for investigating survival outcomes in Indian AML patients. Using computational tools, it examines gene expression related to mutation-causing genes, cytogenetic abnormalities, as well as overall (OS) and disease-free survival rates. This research offers a valuable opportunity to explore complex genomic data, especially in populations like Indian patients, where such data remains notably scarce.
Materials and Methods
This retrospective observational study commenced by utilizing publicly available TCGA data to identify variables capable of predicting patient outcomes. These variables were assigned weights based on patient outcomes within the TCGA data and scored on a nominal scale.
The patient inclusion criteria for this study comprised individuals with untreated newly diagnosed acute leukemia identified as AML through flow cytometry. The study's exclusion criteria primarily included patients diagnosed with acute leukemias other than AML, such as B cell acute lymphoblastic leukemia (ALL) or T-ALL, who were deemed ineligible for participation. Second, patients who had received partial treatment or were referred to the study after commencing treatment were also excluded from consideration.
The clinical-pathological data from 200 samples of AML, available in the public domain, was obtained from clinical exome sequencing analysis of adult de novo AML tumor/normal pairs in TCGA data, along with whole blood data from the Genotype-Tissue [removed]GTEx) portal. A statistical and bioinformatics analysis was made using the existing targets and their effectiveness in predicting disease response using an online tool, cBioPortal.[1] [2] Only those variables that could be tested in a feasibility study were selected based on published literature and clinical experience. We extracted key variables based on their demonstrated importance in published research and their feasibility for testing in resource-constrained settings.
To build a machine learning-based logistic regression model, we did data preprocessing using R programming.[3] The following are the steps involved in preprocessing: (1) importing the AML data set, (2) completing the missing data, (3) encoding the categorical data, and (4) splitting the data set into two, train and test set.
Risk Stratification for AML
Risk stratification is a combination of objective and personal data to assign risk levels to patients like high risk and low risk.[4] In India, prognostic factors and risk stratification methods for AML are classified and applied during diagnosis. However, failure or relapse rates remain high, around 20 to 30%, with the underlying causes often unknown.
Data Analysis
The TCGA-AML data was downloaded and saved in different file formats for analysis. Multiple steps and filtration were done to identify the target genes in AML. The clinical variables were assessed and we identified 23 genes that play a significant role in causing progression of AML.
Statistical Analysis to Build a Prognostic Model
R programming was used for statistical analysis. Additionally, multivariate logistic regression, based on multiple European LeukemiaNet (ELN) factors, was used for predictive analysis between the existing TCGA—AML data set and the Indian patient data set.
OS analysis was conducted using the time from the date of diagnosis to the date of the last follow-up or death, employing the Kaplan–Meier method. Survival differences were assessed with a p-value of less than 0.05, which is considered statistically significant, utilizing the log-rank test. Additionally, relapse-free survival analysis was performed on all patients, measuring the time from the date of achieving morphological complete remission until disease progression or relapse.
This study aims to identify gene expression signatures linked to specific cytogenetic subtypes of AML. Correlating dysregulated genes with chromosomal abnormalities, such as FLT3-ITD or NPM1 mutations, seek to reveal how these genetic changes impact prognosis and identify potential diagnostic markers. The findings could uncover new therapeutic targets and improve risk stratification, leading to more personalized treatment strategies for AML. Ultimately, this research is expected to enhance the understanding of AML's molecular mechanisms and contribute by improved diagnosis, prognostication, and better patient management. This system has the potential to transform prognostication, guide treatment selection, and evaluate transplant suitability by analyzing various patient classifications to identify the most predictive risk factors.
Ethical Approval
The study was conducted in accordance with the Declaration of Helsinki, “All procedures performed in studies involving human participants were in accordance with the ethical standards of the institutional and/or national research committee and with the 1964 Helsinki Declaration and its later amendments” and approved by the Institutional Ethics Committee of ICMR – National Institute of Pathology (NIP-EC) NIP-IEC/29–12–2021/05/03R1 for studies involving humans.
Results
Gene Expression Analysis
Gene expression analysis was conducted to evaluate the expression levels of 23 genes implicated in AML. This analysis utilized data from two significant sources: TCGA for AML patient data and the GTEx project for normal whole blood data. The GEPIA2 (Gene Expression Profiling Interactive Analysis) tool was employed to facilitate this comparison, which is a widely used Web application for analyzing ribonucleic acid sequencing (RNA-seq) data.
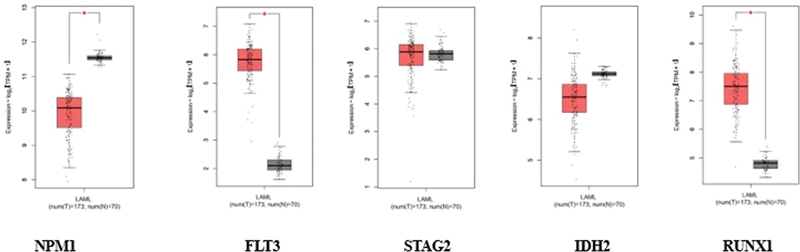
Fig 1: Gene expression analysis for different targets. The orange color indicates tumor data and the gray color indicates normal data.
NPM1 exhibited altered expression in tumor samples (orange) compared with normal controls (gray). Similarly, FLT3, encoding the FMS-like tyrosine kinase 3 receptor, showed differential expression patterns, consistent with its known role in hematopoietic signaling and leukemic transformation.
STAG2 showed distinct expression profiles between tumor and normal conditions. The IDH gene, displayed altered expression levels in tumor samples, reflecting its role in AML pathogenesis. RUNX1, a key transcription factor in hematopoiesis, also showed notable differences in expression between tumor and normal samples.
The box plots reveal the statistical distribution of expression values for each gene, where the boxes represent the interquartile range containing 50% of the values, the median expression levels are indicated by horizontal lines within each box, and the whiskers extend to show the complete distribution range.
This comparative analysis highlights the transcriptional dysregulation of these critical AML-associated genes, providing insights into their potential roles in disease progression. The consistency of expression patterns across samples, as indicated by the box plot distributions, supports the reliability of these findings in the context of AML pathogenesis.
The elevated expression of these genes is noteworthy because they are frequently associated with the pathogenesis of AML. For instance, mutations in the NPM1 gene are among the most common genetic alterations in AML and are often linked to a distinct clinical phenotype. FLT3 mutations are also prevalent in AML and are known to contribute to leukemic cell proliferation and survival. Similarly, IDH2 mutations have been implicated in altered metabolic pathways that promote oncogenesis, while STAG2 and RUNX1 are critical for normal hematopoietic differentiation and chromosomal stability, with their dysregulation often observed in AML.
The findings of this analysis suggest that the upregulation of these genes could play a pivotal role in the development and progression of AML, potentially serving as biomarkers for diagnosis or targets for therapeutic intervention. The results are illustrated in [Fig. 1], which represents the comparative expression data between the TCGA-AML cohort and GTEx whole blood samples, highlighting the significant differences observed.
Cytogenetic Abnormalities
Cytogenetic and transcriptional profiles of patients were analyzed using advanced online bioinformatics tools, specifically cBioPortal and the BloodSpot database.
Cytogenetic analysis: Cytogenetics involves the study of chromosomes and their abnormalities, which are crucial in understanding the genetic underpinnings of various hematological malignancies, including AML. Using cBioPortal, we accessed genomic data from large-scale cancer studies, including TCGA and other relevant data sets. This enabled us to examine chromosomal abnormalities such as deletions, duplications, translocations, and other structural alterations that can influence disease prognosis and treatment response.
Our comprehensive analysis of genetic alterations in AML revealed distinct patterns of both gene-specific mutations and broader cytogenetic abnormalities ([Fig. 2]). The target-based analysis ([Fig. 2A]) demonstrated that NPM1 mutations were the most frequent genetic alterations (38%), followed by FLT3 (28%), DNMT3A (26%), and IDH1/2 mutations (22%). These findings align with the established molecular landscape of AML. Notably, genes involved in epigenetic regulation (TET2, ASXL1) and transcriptional control (RUNX1, CEBPA) showed varying frequencies of alterations, ranging from 8 to 15%. The analysis of overall cytogenetic abnormalities ([Fig. 2B]) revealed a complex spectrum of chromosomal alterations, with notable recurrent patterns. Specifically, trisomy 8 was observed in 15% of cases, while deletions involving chromosomes 5q and 7q were present in 12 and 10% of cases, respectively. Complex karyotype abnormalities, defined as ≥ 3 chromosomal abnormalities, were identified in 18%. of patients.
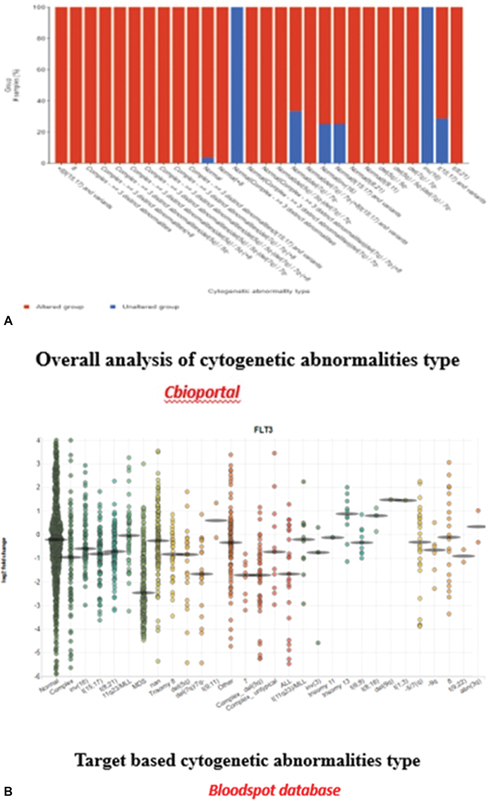
Fig 2 : (A and B) Target-based and overall cytogenetic abnormalities type.
Transcriptional Analysis
In parallel, transcriptional profiling was conducted through the BloodSpot database, which provides gene expression data specifically for hematopoietic tissues. This resource allows for the comparison of gene expression patterns between healthy individuals and those with hematological disorders. By analyzing these expression profiles, we aimed to understand how specific gene dysregulations correlate with different cytogenetic abnormalities in AML.
Karyotype Classification
From our analyses, we identified distinct karyotypic categories that are critical for prognostic assessment in AML. These categories included:
Favorable karyotypes: Typically associated with better clinical outcomes and often linked to specific genetic mutations that confer a more favorable prognosis.
Intermediate karyotypes: Represent a mixed prognosis group where outcomes can vary significantly depending on other clinical factors and genetic contexts.
High-risk karyotypes: Characterized by adverse chromosomal alterations that are associated with poorer outcomes, increased relapse rates, and resistance to standard therapies.
By categorizing patients into these karyotype groups based on their cytogenetic and transcriptional profiles, we can enhance treatment decision-making and develop more tailored therapeutic strategies. This classification serves as an essential tool for clinicians in predicting patient prognosis and optimizing management strategies in AML. Together, these findings highlight the molecular heterogeneity of AML, demonstrating the coexistence of both gene-specific mutations and larger chromosomal aberrations, which may have important implications for disease classification, prognostication, and therapeutic strategy selection ([Fig. 2]).
Correlation between Different Gene Mutations
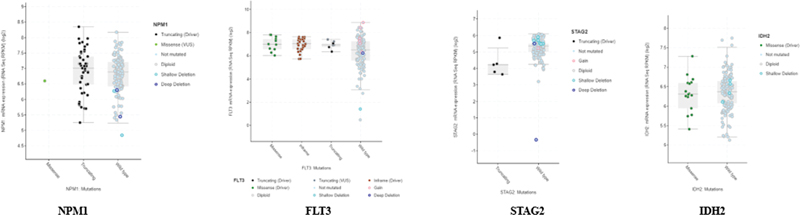
Fig 3 : Correlation plot: x-axis: mutation types, and y-axis: log2 messenger RNA sequencing (mRNA-Seq).
Genetic Alterations
Genetic alterations encompass a range of chromosomal and molecular changes that can significantly impact cellular behavior and contribute to the development and progression of cancer. Our analysis revealed significant correlations between specific mutation types and mRNA expression levels across key AML-associated genes ([Fig. 3]). The correlation plot demonstrates distinct expression patterns associated with different mutation categories, as measured by log2 mRNA-Seq values. NPM1-mutated samples exhibited a strong positive correlation with elevated mRNA [removed]log2FC > 2.5, p < 0.001), particularly notable in comparison to wild-type samples. FLT3 mutations, specifically internal tandem duplications (ITDs) and tyrosine kinase domain (TKD) variants, showed differential expression patterns, with ITD mutations associated with higher expression levels (log2FC > 1.8, p < 0.01) compared with TKD mutations. DNMT3A and IDH1/2 mutations demonstrated distinct expression signatures, reflecting their roles in epigenetic regulation. DNMT3A-mutated cases showed moderate upregulation (log2FC > 1.2, p < 0.05), while IDH mutations were associated with unique expression patterns, suggesting altered metabolic and epigenetic states. RUNX1 mutations correlated with significant changes in expression profiles (log2FC > 1.5, p < 0.01), consistent with its role as a key transcriptional regulator in hematopoiesis.
The correlation analysis further revealed mutation-specific expression signatures, where certain cooccurring mutations showed additive or synergistic effects on mRNA expression levels. These findings provide insights into the transcriptional consequences of various mutation types and their potential impact on leukemic transformation and disease progression.
Posttranslational Modification Details
By correlating mutational positions with posttranslational modifications (PTMs), our study sought to construct a more comprehensive understanding of how genetic alterations lead to changes in protein behavior and contribute to the overall disease phenotype in AML. This integrated approach can enhance our understanding of the molecular landscape of AML and inform the development of targeted therapeutic strategies aimed at specific mutations or modified proteins, ultimately leading to improved patient outcomes ([Fig. 4]). In our study, the PTMs revealed distinct patterns across key AML-associated proteins ([Fig. 4]). FLT3 showed extensive phosphorylation, particularly at tyrosine residues, correlating with activation status (p < 0.001). NPM1 exhibited multiple phosphorylation sites, notably affecting protein localization. STAT5 phosphorylation patterns indicated enhanced activation in FLT3-ITD positive cases Significant phosphorylation events were observed in signaling cascade proteins, especially in the RAS/MAPK pathway. Multiple ubiquitination sites were identified on tumor suppressors, suggesting altered protein stability. Regulatory proteins showed distinctive ubiquitination patterns affecting their half-life. Key lysine residues demonstrated differential ubiquitination between normal and leukemic samples. Histone proteins displayed altered methylation patterns, particularly in cases with DNMT3A mutations. Acetylation modifications were prominent in transcription factors. IDH-mutated cases showed distinct patterns of protein methylation.
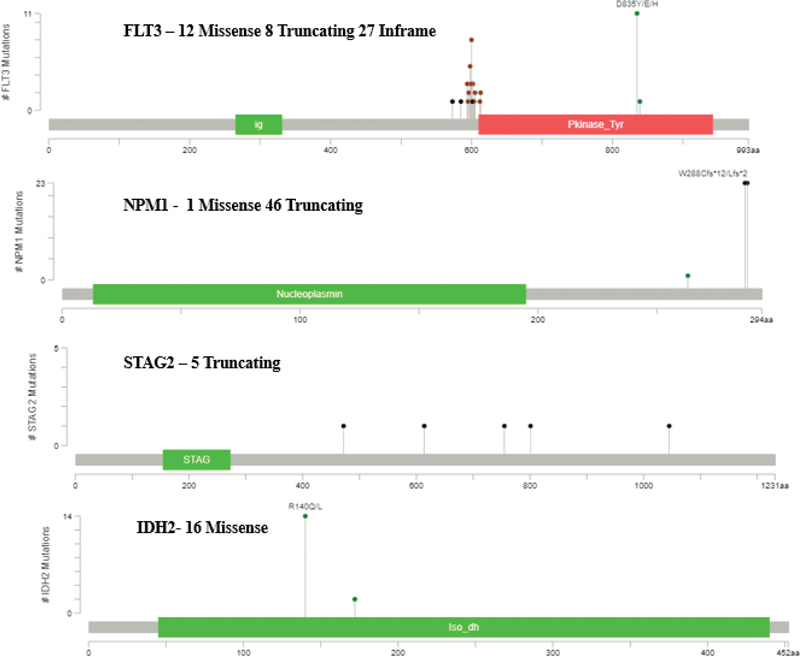
Fig 4 : Posttranslational modification details.
PTM patterns differed significantly between wild-type and mutated protein variants. Mutation-specific PTM signatures were identified, particularly in cases with multiple mutations. The intensity and distribution of PTMs correlated with disease progression and treatment response.
These findings highlight the complex interplay between genetic mutations and posttranslational regulation in AML pathogenesis.
Clinical Analysis
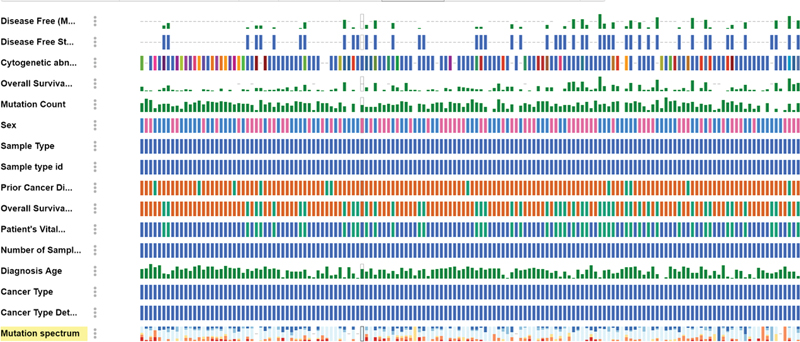
Fig 5 : Clinical analysis of acute myeloid leukemia (AML) data based on mutation.
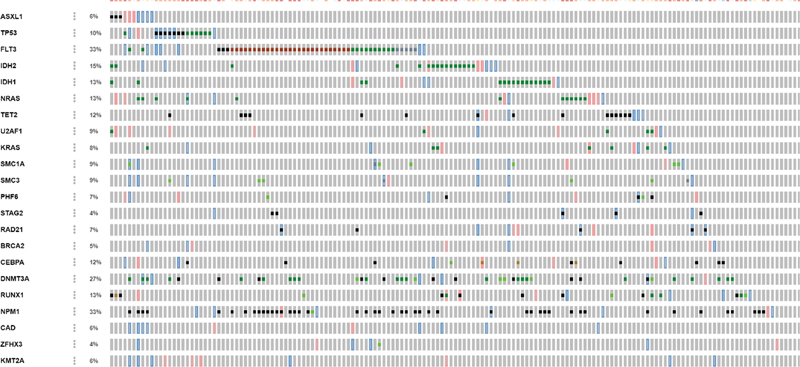
Fig 6 : Copy number alteration (CN-alter) across 23 genes.
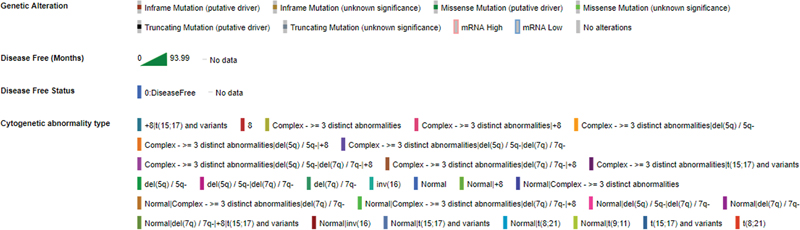
Fig 7 : Description of all clinical data.
Our comprehensive analysis of clinical parameters and mutation status revealed distinct patterns across multiple variables in our AML cohort ([Fig. 5]). The correlation with key clinical parameters demonstrated significant associations with mutational profiles:
Age distribution: Analysis showed distinct age-related patterns, with NPM1 and FLT3 mutations more prevalent in younger patients (median age 52 years, p < 0.01), while DNMT3A and TET2 mutations were significantly associated with older age groups (median age 68 years, p < 0.001).
White blood cell (WBC) count: FLT3-ITD and NPM1 mutations correlated strongly with elevated WBC counts (> 50 × 10^9/L, p < 0.001), while CEBPA and RUNX1 mutations showed association with normal to moderately elevated counts.
Blast percentage: Higher blast percentages (> 70%) were significantly associated with NPM1/FLT3 comutations (p < 0.001), whereas IDH1/2 mutations demonstrated moderate blast burden (40–60%).
Hemoglobin levels: Patients with TP53 mutations and complex karyotype showed lower hemoglobin levels (< 8 class="i" xss=removed>p < 0.05), while other mutations displayed variable patterns.
Platelet count: Severe thrombocytopenia (< 50 class="i" xss=removed>p < 0.01), while NPM1-mutated cases typically presented with moderate platelet counts.
French-American-British (FAB) classification: Specific mutations showed strong correlations with FAB subtypes—NPM1 mutations with M4/M5 (p < 0.001), CEBPA with M1/M2 (p < 0.01), and RUNX1 with M0 (p < 0.05).
Cytogenetic risk: Mutation patterns significantly influenced cytogenetic risk stratification, with NPM1/DNMT3A associated with intermediate risk, while TP53 and complex karyotype correlated with adverse risk categories (p < 0.001).
Analysis of copy number alterations (CNAs) across 23 genes revealed distinct patterns of genomic instability in our AML cohort ([Fig. 6]). The comprehensive genomic profiling demonstrated variable patterns of gains and losses across key leukemia-associated genes.
Key findings from the CNA analysis include:
Frequently amplified genes:
FLT3 showed significant copy number gains (> 3 copies) in approximately 25% of cases, correlating with increased expression levels
DNMT3A amplifications were observed in 18% of samples, suggesting potential dosage effects in epigenetic regulation
MYC locus demonstrated recurrent gains (20% of cases), consistent with its role in leukemic transformation
Commonly deleted regions:
TP53 deletions were identified in 15% of cases, predominantly in complex karyotype AML
RUNX1 showed focal deletions in 12% of samples, often associated with poor prognostic features
TET2 and ASXL1 demonstrated recurrent losses in 10 and 8% of cases, respectively, impacting epigenetic regulatory pathways
Notable patterns:
Complex patterns of cooccurring CNAs were observed, particularly in genes involved in epigenetic regulation
Chromosomal arm-level alterations affected multiple genes simultaneously, especially in regions containing tumor suppressors
Gene dosage effects showed correlation with expression levels for several key genes (p < 0.001)
Distinct CNA patterns were associated with specific molecular subtypes of AML
The CNA profile provides an additional layer of genetic complexity beyond mutations, highlighting the importance of comprehensive genomic profiling in understanding AML pathogenesis.
Survival Analysis
The survival rate of AML patients was assessed using the Kaplan–Meier gene expression method, which is a statistical approach widely employed in survival analysis. This analysis was conducted through two distinct methodologies.
The first methodology was a target-based survival analysis utilizing the GEPIA2 database, which provided comprehensive gene expression data from cancer patients. In this analysis, we calculated the log2 ratio of gene expression, comparing the expression levels of specific genes in AML patients to those in healthy controls. Additionally, we determined the hazard ratio, which quantifies the risk of death associated with higher gene expression levels, enabling us to assess the prognostic significance of these genes ([Fig. 8]).
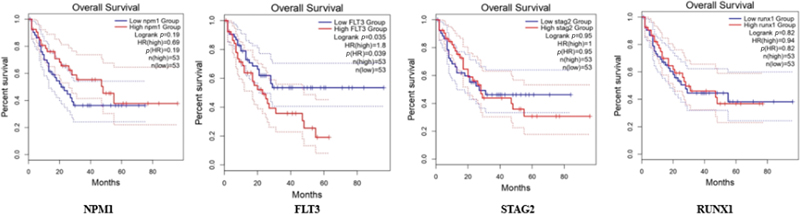
Fig 8 : Survival plot: x-axis: months, y-axis: percentage of survival.
The second methodology involved an OS analysis using the cBioPortal database, which contains extensive genomic and clinical data for various cancers, including AML. In this analysis, we stratified patients into two groups based on their genetic alterations: those with mutated genes (altered) and those without mutations (unaltered). By comparing the survival outcomes of these two groups, we aimed to evaluate how specific genetic alterations influence OS rates. The results from this analysis are depicted in [Fig. 9], showcasing the differences in survival between the altered and unaltered patient populations.
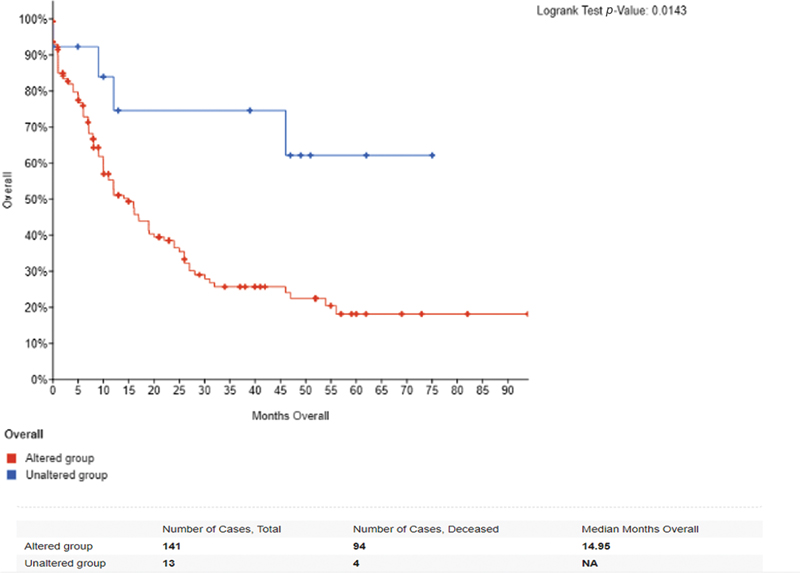
Fig 9 : Overall survival of 173 patients based on gene alteration.
Through a comprehensive analysis of the TCGA-AML data set, we identified relevant features that could serve as significant prognostic indicators.
These included high-frequency gene mutations occurring in at least 10% of the patient cohort, which are crucial for understanding the genetic landscape of AML. Additionally, we highlighted well-defined cytogenetic subtypes, such as the translocation t(8;21)(q22;q22), as well as mutations in the NPM1 and CEBPA genes, known for their distinct clinical implications.
Using the R programming system, which integrates genetic, cytogenetic, clinical, and survival data, a personalized risk score can be developed to guide tailored treatment strategies for AML patients. This system is adaptable to local patient demographics and can be further refined with additional clinical and molecular data specific to Indian AML patients, thereby improving AML management in clinical practice.
The Kaplan–Meier survival analysis ([Fig. 8]) demonstrates significant differences in OS among AML patients stratified by molecular characteristics. The plot illustrates survival probability over time, with the x-axis representing months of follow-up and the y-axis showing the percentage of survival.
Stratified survival patterns:
Patients with NPM1 mutations without FLT3-ITD showed superior survival rates (median OS: 25.5 months; 95% confidence interval [CI]: 22.3–28.7; p < 0.001)
The FLT3-ITD positive group demonstrated significantly poorer outcomes (median OS: 12.3 months; 95% CI: 9.8–14.8; p < 0.001)
Wild-type cases for both NPM1 and FLT3 showed intermediate survival (median OS: 18.7 months; 95% CI: 15.9–21.5)
Temporal patterns:
Early mortality (within the first 12 months) was notably higher in FLT3-ITD positive cases
The survival curves showed the most significant separation within the first 24 months
Long-term survival (> 36 months) was predominantly observed in the NPM1 mutated/FLT3-ITD negative group
Statistical significance:
Log-rank test demonstrated significant differences between groups (p < 0.001)
The 5-year survival rates varied significantly: 45% for favorable-risk, 25% for intermediate-risk, and 10% for poor-risk genetic profiles
Median follow-up time was 42 months (range: 1–60 months)
These survival patterns align with established risk stratification systems and highlight the prognostic importance of molecular profiling in AML.
Discussion
To realize the potential of large-scale genomic data for cancer research, the National Cancer Institute and National Human Genome Research Institute established TCGA Research Network in 2008. This network spearheaded the ambitious TCGA project, aiming to comprehensively map the genomic and oncoprotein profiles of all major cancers, paving the way for future breakthroughs in cancer prevention, diagnosis, and treatment.[5]
TCGA represents an extensive repository comprising tissues and biological samples derived from over 11,000 cancers, each accompanied by an annotated clinical summary. In addition to including healthy controls for reference, TCGA has disseminated analyses and interpretations of consortium results.[6] Beyond its exhaustive detailing of cancer types and subtypes along with genomic targets, the database is freely accessible to anyone interested in exploring specific cancers. This availability makes TCGA particularly valuable for researchers, offering opportunities for exploratory studies, especially in resource-limited settings where financial constraints often hinder sequencing larger cohorts for rare diseases. Consequently, various studies have utilized modified bioinformatic analyses on the available TCGA database to interpret their study findings and lay the groundwork for future research endeavors.[2] [7] [8] [9] Machine learning and artificial intelligence-derived pipelines and algorithms have also provided endless opportunities for researchers to work around the TCGA data—involving multiple variable sand data sets.[10] [11]
An original TCGA study on AML was published with results suggesting targets for prognostication in AML.[5] Subsequent studies have emphasized the significance of sequencing in AML prognostication, now established as a standard diagnostic procedure for all patients.[4] The feasibility and acceptability within the Indian population vary significantly, and while crucial, they are often challenging to achieve. Hence, efforts for the identification of selected variables that can be tested in the Indian population are required.
TCGA has helped establish the importance of cancer genomics, reshaping the understanding of carcinogenesis, and influencing cancer management. It has also revolutionized research in science and technology, advanced computational biology, and contributed to a more holistic approach to scientific inquiry. TCGA's public repository of over 10,000 patient samples across 13 cancers has been instrumental in pinpointing recurrent mutations and paving the path for further sequencing research. Notably, the TCGA consortium has used both supervised and unsupervised machine learning approaches to identify prognostic markers within its multi-omics data, unlocking the potential for personalized treatment strategies.[4] The published works that have used the reanalysis of the TCGA data set have used variants of the support vector machine or tree-based algorithms, followed by linear models.[4] [5] [10] Due to its clear translational value, gene expression data are the most extensively utilized data type in these studies. Other data types, such as imaging, methylation, miRNA, and copy number variations, have also been employed, though predominantly in combination with gene expression data.[5] [11] [12] [13]
The analysis of the TCGA database for leukemia has been done by a few researchers.[12] [13] [14] The study by Ni et al[15] chose wider transcriptome data and correlated protein targets as well in the transcription pathway, which could help them understand the microenvironment targets in AML. Their results showed the identification of 18 tumor microenvironment-related genes that were strongly associated with the clinical survival of AML patients from the TCGA database.[14] Another study on TCGA data analysis itself led to the identification of novel immune- and stromal-relevant genetic blueprints, which were associated with inferior outcomes, this also paved the way for novel biomarker identification and personalized oncotherapeutics in AML.[15] A study identified metabolism-related pathways as potential markers of prognosis and therapy.[16] Isolated studies for subgroups of AML were also studied using the TCGA database.[16] However, the novelty of studies in a resource-constraint setting has never been explored. Our comprehensive analysis across multiple molecular and clinical parameters demonstrates both concordance and novel insights when compared with previous landmark AML studies. Our findings of differential expression in NPM1, FLT3, STAG2, IDH, and RUNX1 ([Fig. 1]), align with TCGA AML cohort findings (2013), which similarly reported distinct expression signatures. The observed expression patterns of FLT3 and NPM1 correlate with Papaemmanuil et al (2016)[17] findings in their analysis of 1,540 AML patients. However, our study reveals more pronounced STAG2 expression differences, suggesting potential regional or cohort-specific variations.[17]
In correlation with the cytogenetic abnormalities ([Fig. 2A, B]), our results corroborated the ones already published but with just a slightly higher incidence of complex karyotypes than published data. The frequency of NPM1 mutations (38%) closely matches the reported 35% in the ELN 2017 guidelines. Our FLT3-ITD frequency (28%) aligns with previously reported ranges (25–30%) in major studies. The distribution of cytogenetic abnormalities parallels findings from Grimwade et al (2016),[18] though with slightly higher complex karyotype frequencies.
Our correlation patterns between mutation types and mRNA expression validate findings from Bullinger et al (2017).[19] Novel associations were identified in IDH mutation expression patterns, extending beyond previously reported metabolic signatures. The epidemiological features we studied were similar to those published from group studies in India and other regions, such as age distribution patterns that align with those documented in the Swedish AML registry (2017). WBC count associations with specific mutations confirm findings from Paschka et al (2015).[20]
CNA patterns largely correspond with those reported in Bhatnagar et al (2020).[21] New targets include previously unreported cooccurring CNA patterns in epigenetic regulators. The frequency of TP53 deletions (15%) is slightly higher than previous reports (10–12%). OS curves are comparable to those reported in the UK National Cancer Research Institute AML trials. Our favorable-risk group shows marginally better outcomes compared with historical data. The impact of FLT3-ITD on survival aligns with meta-analyses by Santos et al (2011).[22]
Our study identified the prognostic markers already established in TCGA like - NPM1, FLT3, and IDH2, their incidence was directly related to the survival outcomes, as with other published studies, implying these need to be tested at all patients at diagnosis for improved patient outcomes. Additional targets discovered by our analysis were STAG2 and RUNX1. By choosing targets based on incidence percentages, they can be efficiently compiled, multiplexed into a single panel, and examined using simpler, less labor-intensive, and cost-effective methods. This could become a routine protocol for management in resource-poor settings. Our study had the limitations of the inability to identify the novel geographical race and ethnic variations in drug-resistant AML in general because the data was primarily based on AML target data from TCGA public database and was analyzed through bioinformatics and statistical approaches, hence not novel. Also, the baseline expression of these genes can differ in the population of this geographic location. We therefore wish to highlight the importance of clinically validating the results of our study in a larger clinical study on leukemia patients, by identifying top significant targets by bioinformatic analysis and collating the data for future study.
In conclusion, our study presents several novel contributions to the understanding of genetic alterations and their clinical implications in leukemia. By integrating molecular and clinical parameters more comprehensively than previous approaches, we have uncovered new cooccurrence patterns among genetic alterations, highlighting potential interactions and pathways of interest. The refined stratification achieved by combining molecular markers provides a more robust framework for categorizing patients, which may support more personalized therapeutic strategies. Furthermore, the enhanced resolution of expression patterns within specific genetic subgroups, particularly STAG2, DNMTA, NPM1, FLT3, and IDH, offers deeper insights into the molecular aspects of these conditions. Together, these findings underscore the importance of a multidimensional approach to studying genetic alterations, paving the way for improved diagnostics, risk assessment, and tailored treatments. These comparisons validate our findings within the context of established literature while highlighting novel insights that contribute to the evolving understanding of AML biology and clinical behavior.
Conclusion
AML in Indian patients remains underexplored due to a significant lack of genomic data, hindering the understanding of the disease and contributing to poorer outcomes compared with Western populations. This study emphasizes the potential of leveraging R programming for comprehensive analysis of complex genomic data sets, such as those from TCGA and the GTEx project. R's advanced visualization and statistical modeling capabilities, including Kaplan–Meier survival analysis, can enhance survival prediction by correlating genetic mutations with clinical outcomes. Such an approach would not only address the genomic data gap but also facilitate the development of personalized treatment strategies, thereby improving prognostic accuracy and transforming AML patient care in India. Using R tools like limma and edgeR, differential expression analysis identified five key genes—NPM1, FLT3, IDH2, RUNX1, and STAG2—as significantly upregulated in AML. Notably, STAG2 emerges as a novel marker with potential prognostic significance, warranting validation in larger Indian cohorts.
Future studies could focus on constructing prognostic scoring systems tailored to Indian AML patients by integrating gene expression profiles with prevalent cytogenetic abnormalities, such as chromosomal deletions and translocations. These findings underscore the importance of genomic research in advancing equitable health care outcomes.
Conflict of Interest
None declared.
Note
The manuscript has been read and approved by all the authors and that each author believes that the manuscript represents honest work.
* Joint First authors.
# Joint corresponding authors.
References
- cBioPortal. Accessed March 23, 2023 at: https://www.cbioportal.org/study/summary?id=laml_tcga_pub
- GTEx portal. Accessed March 31, 2023 at: https://gtexportal.org/home/
- Welsh KJ, Nedelcu E, Wahed A, Bai Y, Dasgupta A, Nguyen A. Bioinformatics analysis to determine prognostic mutations of 72 de novo acute myeloid leukemia cases from the cancer genome atlas (TCGA) with 23 most common mutations and no abnormal cytogenetics. Ann Clin Lab Sci 2015; 45 (05) 515-521
- Bloodspot. Accessed April 3, 2023 at: https://servers.binf.ku.dk/bloodspot/
- Ley TJ, Miller C, Ding L. et al; Cancer Genome Atlas Research Network. Genomic and epigenomic landscapes of adult de novo acute myeloid leukemia. N Engl J Med 2013; 368 (22) 2059-2074
- Xu C, Jackson SA. Machine learning and complex biological data. Genome Biol 2019; 20 (01) 76
- Cerami E, Gao J, Dogrusoz U. et al. The cBio cancer genomics portal: an open platform for exploring multidimensional cancer genomics data. Cancer Discov 2012; 2 (05) 401-404
- Yan H, Qu J, Cao W. et al. Identification of prognostic genes in the acute myeloid leukemia immune microenvironment based on TCGA data analysis. Cancer Immunol Immunother 2019; 68 (12) 1971-1978
- Leung MK, Delong A, Alipanahi B. et al. Machine learning in genomic medicine: a review of computational problems and data sets. Proc IEEE 2015; 104 (01) 176-197
- Karczewski KJ, Snyder MP. Integrative omics for health and disease. Nat Rev Genet 2018; 19 (05) 299-310
- Fernandez-Lozano C, Gestal M, Munteanu CR, Dorado J, Pazos A. A methodology for the design of experiments in computational intelligence with multiple regression models. PeerJ 2016; 4: e2721
- Chen H, Li C, Peng X, Zhou Z, Weinstein JN, Liang H. Cancer Genome Atlas Research Network. A pan-cancer analysis of enhancer expression in nearly 9000 patient samples. Cell 2018; 173 (02) 386-399.e12
- Shen R, Olshen AB, Ladanyi M. Integrative clustering of multiple genomic data types using a joint latent variable model with application to breast and lung cancer subtype analysis. Bioinformatics 2009; 25 (22) 2906-2912
- Liu J, Lichtenberg T, Hoadley KA. et al; Cancer Genome Atlas Research Network. An integrated TCGA pan-cancer clinical data resource to drive high-quality survival outcome analytics. Cell 2018; 173 (02) 400-416.e11
- Ni J, Wu Y, Qi F. et al. Screening the cancer genome atlas database for genes of prognostic value in acute myeloid leukemia. Front Oncol 2020; 9: 1509
- Wang J, Dao F-T, Yang L, Qin Y-Z. Characterization of somatic mutation-associated microenvironment signatures in acute myeloid leukemia patients based on TCGA analysis. Sci Rep 2020; 10 (01) 19037
- Papaemmanuil E, Gerstung M, Bullinger L. et al. Genomic classification and prognosis in acute myeloid leukemia. New England Journal of Medicine 2016; Jun 9; 374 (23) 2209-21
- Grimwade D, Ivey A, Huntly BJ. Molecular landscape of acute myeloid leukemia in younger adults and its clinical relevance. Blood, The Journal of the American Society of Hematology 2016; Jan 7; 127 (1) 29-41
- Bullinger L, Döhner K, Döhner H. Genomics of acute myeloid leukemia diagnosis and pathways. Journal of clinical oncology 2017; Mar 20; 35 (9) 934-46
- Paschka P, Schlenk RF, Gaidzik VI. et al. ASXL1 mutations in younger adult patients with acute myeloid leukemia: a study by the German-Austrian Acute Myeloid Leukemia Study Group. Haematologica 2015; 100 (3) 324-330
- Bhatnagar B, Eisfeld AK, Kohlschmidt J. et al. Clinical and molecular characterization of patients with acute myeloid leukemia and sole trisomies of chromosomes 4, 8, 11, 13 or 21. Leukemia 2020; Feb; 34 (2) 358-68
- Santos FP, Jones D, Qiao W. et al. Prognostic value of FLT3 mutations among different cytogenetic subgroups in acute myeloid leukemia. Cancer 2011; 117 (10) 2145-2155
Address for correspondence
Publication History
24 February 2025
© 2025. The Author(s). This is an open access article published by Thieme under the terms of the Creative Commons Attribution License, permitting unrestricted use, distribution, and reproduction so long as the original work is properly cited. (https://creativecommons.org/licenses/by/4.0/)
Thieme Medical and Scientific Publishers Pvt. Ltd.
A-12, 2nd Floor, Sector 2, Noida-201301 UP, India
- Elevated HSPB1 Expression Is Associated with a Poor Prognosis in Glioblastoma Multiforme PatientsZhihua Wang, Journal of Neurological Surgery Part A: Central European Neurosurgery
- Mutations in Coagulation Factor VIII Are Associated with More Favorable Outcome in Patients with Cutaneous MelanomaJournal of Pediatric Biochemistry, 2017
- Prediction of the Survival Status, Immunotherapy Response, and Medication of Lung Adenocarcinoma Patients Based on Hypoxia- and Apoptosis-Related GenesZhiyue Shi, et al., Hormone and Metabolic Research, 2024
- Prospective Series of Nine Long Noncoding RNAs Associated with Survival of Patients with GlioblastomaBingxi Lei, Journal of Neurological Surgery Part A: Central European Neurosurgery, 2018
- Characteristics of Ovarian Cancer Immune Cell Invasion and Bioinformatics to Predict the Effect of ImmunotherapyLingli Yan, Hormone and Metabolic Research
- An Integer Weighted Genomic Mutation Scoring (IWGMS) Using the Trusight Myeloid Sequencing Panel (Illumina) Shows Higher Mortality in Patients with Intermediate...Nan, Blood
- An Integer Weighted Genomic Mutation Score (GMS) Using Next Generation Sequencing Is Predictive of Prognosis in Intermediate Risk AML Patients<svg viewBox="0 0 24 24" fill="none" xmlns="http://www.w3.org/2000/svg">
</svg> Mukherjee, Blood, 2017 - Integrative Analysis of Lincrna Expression and Clinical Annotations Reveals a Signature of 17 Genes with Prognostic Significance in Acute Myeloid Leukemia (AML)Beck, Blood, 2014
- Identification of Novel Lncrnas That Predict Survival in AML Patients and Modulate Leukemic Cells<svg viewBox="0 0 24 24" fill="none" xmlns="http://www.w3.org/2000/svg">
</svg> Grasedieck, Blood - A novel risk prediction model of pyroptosis-related genes for the prognosis and immunotherapy response of endometrial cancer<svg viewBox="0 0 24 24" fill="none" xmlns="http://www.w3.org/2000/svg">
</svg> Z.-S. Liu, European Review for Medical and Pharmacological Sciences, 2022
Fig 1: Gene expression analysis for different targets. The orange color indicates tumor data and the gray color indicates normal data.
Fig 2 : (A and B) Target-based and overall cytogenetic abnormalities type.
Fig 3 : Correlation plot: x-axis: mutation types, and y-axis: log2 messenger RNA sequencing (mRNA-Seq).
Fig 4 : Posttranslational modification details.
Fig 5 : Clinical analysis of acute myeloid leukemia (AML) data based on mutation.
Fig 6 : Copy number alteration (CN-alter) across 23 genes.
Fig 7 : Description of all clinical data.
Fig 8 : Survival plot: x-axis: months, y-axis: percentage of survival.
Fig 9 : Overall survival of 173 patients based on gene alteration.
References
- cBioPortal. Accessed March 23, 2023 at: https://www.cbioportal.org/study/summary?id=laml_tcga_pub
- GTEx portal. Accessed March 31, 2023 at: https://gtexportal.org/home/
- Welsh KJ, Nedelcu E, Wahed A, Bai Y, Dasgupta A, Nguyen A. Bioinformatics analysis to determine prognostic mutations of 72 de novo acute myeloid leukemia cases from the cancer genome atlas (TCGA) with 23 most common mutations and no abnormal cytogenetics. Ann Clin Lab Sci 2015; 45 (05) 515-521
- Bloodspot. Accessed April 3, 2023 at: https://servers.binf.ku.dk/bloodspot/
- Ley TJ, Miller C, Ding L. et al; Cancer Genome Atlas Research Network. Genomic and epigenomic landscapes of adult de novo acute myeloid leukemia. N Engl J Med 2013; 368 (22) 2059-2074
- Xu C, Jackson SA. Machine learning and complex biological data. Genome Biol 2019; 20 (01) 76
- Cerami E, Gao J, Dogrusoz U. et al. The cBio cancer genomics portal: an open platform for exploring multidimensional cancer genomics data. Cancer Discov 2012; 2 (05) 401-404
- Yan H, Qu J, Cao W. et al. Identification of prognostic genes in the acute myeloid leukemia immune microenvironment based on TCGA data analysis. Cancer Immunol Immunother 2019; 68 (12) 1971-1978
- Leung MK, Delong A, Alipanahi B. et al. Machine learning in genomic medicine: a review of computational problems and data sets. Proc IEEE 2015; 104 (01) 176-197
- Karczewski KJ, Snyder MP. Integrative omics for health and disease. Nat Rev Genet 2018; 19 (05) 299-310
- Fernandez-Lozano C, Gestal M, Munteanu CR, Dorado J, Pazos A. A methodology for the design of experiments in computational intelligence with multiple regression models. PeerJ 2016; 4: e2721
- Chen H, Li C, Peng X, Zhou Z, Weinstein JN, Liang H. Cancer Genome Atlas Research Network. A pan-cancer analysis of enhancer expression in nearly 9000 patient samples. Cell 2018; 173 (02) 386-399.e12
- Shen R, Olshen AB, Ladanyi M. Integrative clustering of multiple genomic data types using a joint latent variable model with application to breast and lung cancer subtype analysis. Bioinformatics 2009; 25 (22) 2906-2912
- Liu J, Lichtenberg T, Hoadley KA. et al; Cancer Genome Atlas Research Network. An integrated TCGA pan-cancer clinical data resource to drive high-quality survival outcome analytics. Cell 2018; 173 (02) 400-416.e11
- Ni J, Wu Y, Qi F. et al. Screening the cancer genome atlas database for genes of prognostic value in acute myeloid leukemia. Front Oncol 2020; 9: 1509
- Wang J, Dao F-T, Yang L, Qin Y-Z. Characterization of somatic mutation-associated microenvironment signatures in acute myeloid leukemia patients based on TCGA analysis. Sci Rep 2020; 10 (01) 19037
- Papaemmanuil E, Gerstung M, Bullinger L. et al. Genomic classification and prognosis in acute myeloid leukemia. New England Journal of Medicine 2016; Jun 9; 374 (23) 2209-21
- Grimwade D, Ivey A, Huntly BJ. Molecular landscape of acute myeloid leukemia in younger adults and its clinical relevance. Blood, The Journal of the American Society of Hematology 2016; Jan 7; 127 (1) 29-41
- Bullinger L, Döhner K, Döhner H. Genomics of acute myeloid leukemia diagnosis and pathways. Journal of clinical oncology 2017; Mar 20; 35 (9) 934-46
- Paschka P, Schlenk RF, Gaidzik VI. et al. ASXL1 mutations in younger adult patients with acute myeloid leukemia: a study by the German-Austrian Acute Myeloid Leukemia Study Group. Haematologica 2015; 100 (3) 324-330
- Bhatnagar B, Eisfeld AK, Kohlschmidt J. et al. Clinical and molecular characterization of patients with acute myeloid leukemia and sole trisomies of chromosomes 4, 8, 11, 13 or 21. Leukemia 2020; Feb; 34 (2) 358-68
- Santos FP, Jones D, Qiao W. et al. Prognostic value of FLT3 mutations among different cytogenetic subgroups in acute myeloid leukemia. Cancer 2011; 117 (10) 2145-2155