PDF
PDF  Views
Views  Share
Share


Clinical Profile of Acute Myeloid Leukemia in North India and Utility of Nontransplant Measures in its Management
CC BY-NC-ND 4.0 ? Indian J Med Paediatr Oncol 2019; 40(S 01): S44-S53
DOI: DOI: 10.4103/ijmpo.ijmpo_175_17
Abstract
Introduction:?Acute myeloid leukemia (AML) is a clonal accumulation of myeloid precursors in body tissues, which ultimately leads to bone marrow failure. This is an 8-year prospective, observational study in which 254 patients were enrolled.?Aim of the Study:?To document the clinical profile of AML and differential outcome in M3 versus non-M3 phenotype and to see impact of different variables on its survival.?Methods:?Patients enrolled in the study were examined, evaluated, and given standard 3:7 induction protocol, and acute promyelocytic leukemia (APML) patients were given the ICAPL 2006 protocol.?Results:?In our study, males outnumbered females and most of our patients were in 20?60 years of age group. The better prognosis was in patients who were in the second decade of life. Total leukocyte count and platelet count had a significant impact on the survival of the a patient. Bone marrow morphology of M3 type has extremely good prognosis and was the most common FAB type seen in our study. Flow cytometric markers such as CD15, CD33, CD117, and myeloperoxidase had positivity among 90% of patients. Overall survival is around 40% in whole-study group, 87% in APML group, and 16.5% in non-M3 group. There are still unmet needs in managing the non-M3 patients in resource-constraint countries where allogenic transplant and newer drugs have the least access. For improving the outcome in M3 AML, further newer molecules such as Flt3 and PIK3 inhibitors are being used in trials.?Conclusion:?There are still unmet needs in managing the non-M3 patients in resource-constraint countries where allogenic transplant and newer drugs have the least access. For improving the outcome in M3 AML, further newer molecules such as Flt3 and PIK3 inhibitors are being used in trials.
Keywords
Acute myeloid leukemia - acute promyelocytic leukemia - cluster differentiation - event-free survival - myelodysplastic leukemia - myeloperoxidase - overall survival - reverse-transcriptase polymerase chain reaction - total leukocyte countPublication History
Article published online:
24 May 2021
? 2019. Indian Society of Medical and Paediatric Oncology. This is an open access article published by Thieme under the terms of the Creative Commons Attribution-NonDerivative-NonCommercial-License, permitting copying and reproduction so long as the original work is given appropriate credit. Contents may not be used for commercial purposes, or adapted, remixed, transformed or built upon. (https://creativecommons.org/licenses/by-nc-nd/4.0/).
Thieme Medical and Scientific Publishers Pvt. Ltd.
A-12, 2nd Floor, Sector 2, Noida-201301 UP, India
Abstract
Introduction:?Acute myeloid leukemia (AML) is a clonal accumulation of myeloid precursors in body tissues, which ultimately leads to bone marrow failure. This is an 8-year prospective, observational study in which 254 patients were enrolled.?Aim of the Study:?To document the clinical profile of AML and differential outcome in M3 versus non-M3 phenotype and to see impact of different variables on its survival.?Methods:?Patients enrolled in the study were examined, evaluated, and given standard 3:7 induction protocol, and acute promyelocytic leukemia (APML) patients were given the ICAPL 2006 protocol.?Results:?In our study, males outnumbered females and most of our patients were in 20?60 years of age group. The better prognosis was in patients who were in the second decade of life. Total leukocyte count and platelet count had a significant impact on the survival of the a patient. Bone marrow morphology of M3 type has extremely good prognosis and was the most common FAB type seen in our study. Flow cytometric markers such as CD15, CD33, CD117, and myeloperoxidase had positivity among 90% of patients. Overall survival is around 40% in whole-study group, 87% in APML group, and 16.5% in non-M3 group. There are still unmet needs in managing the non-M3 patients in resource-constraint countries where allogenic transplant and newer drugs have the least access. For improving the outcome in M3 AML, further newer molecules such as Flt3 and PIK3 inhibitors are being used in trials.?Conclusion:?There are still unmet needs in managing the non-M3 patients in resource-constraint countries where allogenic transplant and newer drugs have the least access. For improving the outcome in M3 AML, further newer molecules such as Flt3 and PIK3 inhibitors are being used in trials.
Keywords
Acute myeloid leukemia - acute promyelocytic leukemia - cluster differentiation - event-free survival - myelodysplastic leukemia - myeloperoxidase - overall survival - reverse-transcriptase polymerase chain reaction - total leukocyte countIntroduction
Acute myeloid leukemia (AML) is a heterogeneous hematologic malignancy characterized by clonal expansion of myeloid blasts in the peripheral blood, bone marrow, and/or other tissues, which leads to impaired production of normal blood cells. Thus, leukemic cell infiltration in the marrow invariably leads to bone marrow failure manifesting in the form of anemia or thrombocytopenia, while absolute neutrophil count may be low or normal, depending on the total white cell count.[1]
The underlying pathophysiology in AML consists of a maturational arrest of bone marrow cells in the earliest stages of development. The mechanism of this arrest is under study, but in many cases, it involves the activation of abnormal genes through chromosomal translocations and other genetic abnormalities.[2] [3] Those genetic changes can be inherited or acquired to some environmental insult. AML accounts for approximately 20% of acute leukemia in children and 80% of acute leukemia in adults. The incidence of AML progressively increases with age, and in adults over the age of 65 years, the incidence is approximately 30 times the incidence of AML in children. The highest rate of childhood AML is in Asia and the lowest in North America and India.[4]
As per the SEER database, the number of new cases of AML was 4.2 per 100,000 men and women per year. The number of deaths was 2.8 per 100,000 men and women per year. These rates are age adjusted and based on 2010?2014 cases and deaths. AML is most frequently diagnosed among people aged 65?74 years. Median age at diagnosis is 68 years.[5]
The most common risk factor for AML is the presence of an antecedent hematologic disorder, the most common of which is myelodysplastic syndrome. Some congenital disorders that predispose patients to AML include Bloom syndrome, Down syndrome, congenital neutropenia, Fanconi anemia, and neurofibromatosis. Usually, these patients develop AML during childhood; rarely, some may present in young adulthood.
Radiation exposure, smoking, and exposure to benzene have been found to be associated with AML.
As more patients with cancer survive along their primary malignancy, the number of patients with AML increases because of exposure to chemotherapeutic agents. For example, the cumulative incidence of acute leukemia in patients with breast cancer who were treated with doxorubicin and cyclophosphamide as adjuvant therapy was 0.2%?1.0% at 5 years.[6]
Patients with previous exposure to chemotherapeutic agents can be divided into two groups: (1) those with previous exposure to alkylating agents and (2) those with exposure to topoisomerase-II inhibitors. Patients with a previous exposure to topoisomerase-II inhibitors do not have a myelodysplastic phase. Cytogenetic testing reveals a translocation that involves band 11q23. Less commonly, patients developed leukemia with other balanced translocations, such as inversion 16 or t(15;17).[7] The typical latency period between drug exposure and acute leukemia is approximately 3?5 years for alkylating agents/radiation exposure, but it is only 9?12 months for topoisomerase inhibitors.
The newer who classification is based on molecular markers and morphology [Table 1].[8] The European Leukemia Network has divided AML into three risk groups, as favorable-risk, intermediate-risk, and poor-risk groups [Table 2].[9]
|
AML and related neoplasms |
|---|
|
AML ? Acute myeloid leukemia APL ? Acute promyelocytic leukemia; NOS ? Not otherwise specified; TAM ? Transient abnormal myelopoiesis |
|
?AML with recurrent genetic abnormalities |
|
?AML with t(8;21)(q22;q22.1); RUNX1-RUNX1T1 |
|
?AML with inv(16)(p13.1q22) or t(16;16)(p13.1;q22); |
|
?CBFB-MYH11 |
|
?APL with PML-RARA |
|
?AML with t(9;11)(p21.3;q23.3);MLLT3-KMT2A |
|
?AML with t(6;9)(p23;q34.1);DEK-NUP214 |
|
?AML with inv(3)(q21.3q26.2) or t(3;3)(q21.3;q26.2); GATA2, MECOM |
|
?AML (megakaryoblastic) with t(1;22)(p13.3;q13.3); |
|
?RBM15-MKL1 |
|
?AML with mutated NPM1 |
|
?AML with biallelic mutations of CEBPA |
|
AML with myelodysplasia-related changes |
|
Therapy-related myeloid neoplasms |
|
AML, NOS |
|
?AML with minimal differentiation |
|
?AML without maturation |
|
?AML with maturation |
|
?Acute myelomonocytic leukemia |
|
?Acute monoblastic/monocytic leukemia |
|
?Pure erythroid leukemia |
|
?Acute megakaryoblastic leukemia |
|
?Acute basophilic leukemia |
|
?Acute panmyelosis with myelofibrosis |
|
Myeloid sarcoma |
|
Myeloid proliferations related to down syndrome |
|
?TAM |
|
?Myeloid leukemia associated with down syndrome |
|
Risk category* |
Genetic abnormality |
|---|---|
|
ECOG ? Eastern Cooperative Oncology Group; PS ? Performance status; DM ? Diabetes mellitus; HTN ? Hypertension; HCT ? Hematopoietic cell transplantation; CI ? Comorbidity index; LDAC ? Low-dose cytarabine arabinoside; IC ? Induction chemotherapy; MDS ? Myelodysplastic syndrome; WBC ? White blood cell; Hb ? Hemoglobin; BM ? Bone marrow |
|
|
Favorable |
t(8;21)(q22;q22.1); RUNX1-RUNX1T1 |
|
Inv(16)(p13.1;q22) or t(16;16)(p13.1;q22); CBFB-MYH11 |
|
|
Mutated NPM1 without FLT3-ITD or with FLT3-ITD |
|
|
Biallelic mutated CEBPA |
|
|
Intermediate |
Mutated NPM1 and FLT3-ITD high |
|
Wild-type NPM1 without FLT3-ITD or with FLT3-ITD low (without adverse-risk genetic lesions) |
|
|
t(9;11)(p21.3;q23.3); MLLT3-KMT2A |
|
|
Cytogenetic abnormalities not classified as favorable or adverse |
|
|
Adverse |
t(6;9)(p23;q34.1); DEK-NUP214 |
|
t(v; 11q23.3); KMT2A rearranged |
|
|
t(9;22)(q34.1;q11.2); BCR-ABL1 |
|
|
Inv(3)(q21.3q26.2) or t(3;3)(q21.3;q26.2); GATA2,MECOM(EVI1) -5 or del (5q); ?7; ?17/abn(17p) |
|
|
Complex karyotype, monosomal karyotype |
|
|
Wild-type NPM1 and FLT3-ITD high |
|
|
Mutated RUNX1 |
|
|
Mutated ASXL1 |
|
|
Mutated TP53 |
|
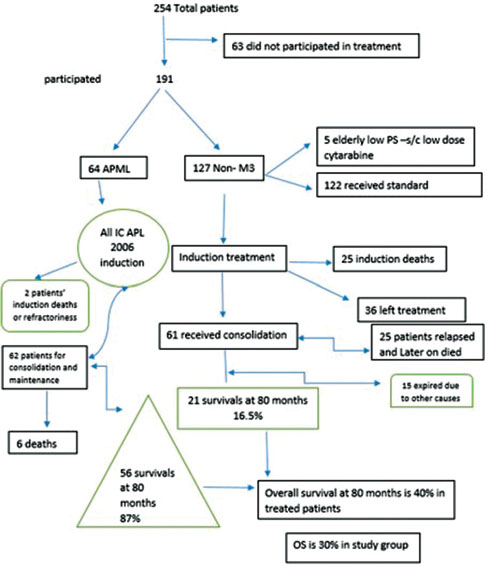
|?Figure. 1? Study design|
Males were 142 and females were 112; ratio was 1.2:1. With respect to FAB type, i.e. M3 and non-M3, there was equal number of male and female. Patients were divided into four groups based on their age groups, viz., <10>61 years. Maximum patients belonged to 21?60 years of age (57.5%) and least patients belonged to <10>
The most common presenting symptoms were related to features of symptomatic anemia which were seen in 44.9% of the patients followed by fever (37.8%), followed by bleeding. In M3, most common symptoms were related to bleeding, while in non-M3, most common symptoms were related to anemia. Rarer presentations included symptoms of chloromas which was seen in periorbital areas, parotid, and uterus. Other rarer presentations include symptoms of hearing loss and recurrent boils, and few were incidentally discovered when investigations were done for another reasons [Table 3]. The most common sign was pallor (57.4%), organomegaly (22.4%) followed by lymphadenopathy (16.1%). Chloromas were seen in only 1.2% of patients. Pallor continued to be the most common sign after dividing patients into M3 and non-M3, with organomegaly and chloromas more common in non-M3 [Table 4].
|
Symptoms |
Number of- patients/ percentages |
AML type |
Total |
|
|---|---|---|---|---|
|
M3 |
Others |
|||
|
AML ? Acute myeloid leukemia |
||||
|
Anemia |
Count |
6 |
28 |
34 |
|
Percentage within AML type |
10.3 |
24.1 |
19.5 |
|
|
Fever |
Count |
5 |
17 |
22 |
|
Percentage within AML type |
8.6 |
14.7 |
12.6 |
|
|
Bleeding |
Count |
16 |
2 |
18 |
|
Percentage within AML type |
27.6 |
1.7 |
10.3 |
|
|
Anemia+fever |
Count |
2 |
20 |
22 |
|
Percentage within AML type |
3.4 |
17.2 |
12.6 |
|
|
Anemia + bleeding |
Count |
11 |
12 |
23 |
|
Percentage within AML type |
19.0 |
10.3 |
13.2 |
|
|
Fever + bleeding |
Count |
8 |
10 |
18 |
|
Percentage within AML type |
13.8 |
8.6 |
10.3 |
|
|
Anemia + fever + |
Count |
7 |
14 |
21 |
|
bleeding |
Percentage within AML type |
12.1 |
12.1 |
12.1 |
|
Others |
Count |
3 |
13 |
16 |
|
Percentage Within AML type |
5.2 |
11.2 |
9.2 |
|
|
Total |
Count |
58 |
116 |
174 |
|
Percentage within AML type |
100.0 |
100.0 |
100.0 |
|
|
Signs |
Number of- patients/ percentages |
AML type |
Total |
|
|---|---|---|---|---|
|
M3 |
Others |
|||
|
LAP ? Leukocyte alkaline phosphatase; AML ? Acute myeloid leukemia |
||||
|
Pallor |
Count |
31 |
46 |
77 |
|
Percentage within AML type |
58.5 |
41.8 |
47.2 |
|
|
LAP |
Count |
0 |
2 |
2 |
|
Percentage within AML type |
0.0 |
1.8 |
1.2 |
|
|
Organomegaly |
Count |
2 |
2 |
4 |
|
Percentage within AML type |
3.8 |
1.8 |
2.5 |
|
|
Gingival hyperplasia |
Count |
1 |
0 |
1 |
|
Percentage within AML type |
1.9 |
0.0 |
0.6 |
|
|
Chloroma |
Count |
0 |
3 |
3 |
|
Percentage within AML type |
0.0 |
2.7 |
1.8 |
|
|
Pallor + LAP |
Count |
1 |
9 |
10 |
|
Percentage within AML type |
1.9 |
8.2 |
6.1 |
|
|
LAP + organomegaly |
Count |
0 |
2 |
2 |
|
Percentage within AML type |
0.0 |
1.8 |
1.2 |
|
|
Pallor + organomegaly |
Count |
7 |
18 |
25 |
|
Percentage within AML type |
13.2 |
16.4 |
15.3 |
|
|
Pallor + LAP + organomegaly |
Count |
1 |
12 |
13 |
|
Percentage within AML type |
1.9 |
10.9 |
8.0 |
|
|
Pallor + LAP + organomegaly + gingival hyperplasia |
Count |
3 |
6 |
9 |
|
Percentage within AML type |
5.7 |
5.5 |
5.5 |
|
|
Others |
Count |
2 |
3 |
5 |
|
Percentage within AML type |
3.8 |
2.7 |
3.1 |
|
|
Normal |
Count |
5 |
7 |
12 |
|
Percentage within AML type |
9.4 |
6.4 |
7.4 |
|
|
Total |
Count |
53 |
110 |
163 |
|
Percentage within AML type |
100.0 |
100.0 |
100.0 |
|
|
FAB type |
Frequency (%) |
|---|---|
|
MDS ? Myelodysplastic syndrome; AML ? Acute myeloid leukemia |
|
|
M0 |
8(3.1) |
|
M1 |
34 (13.4) |
|
M2 |
58 (22.8) |
|
M3 |
64 (25.2) |
|
M4 |
8(3.1) |
|
M5 |
5 (2.0) |
|
M6 |
8 (3.1) |
|
M7 |
3 (1.2) |
|
MDS progress to AML |
6 (2.4) |
|
Total |
194 (76.4) |
|
Unknown |
60 (23.6) |
|
Total |
254 (100.0) |
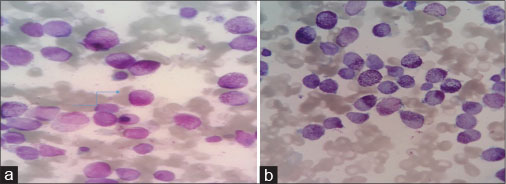
|?Figure. 2 (a)? Promyelocytes with granular cytoplasm. (b) With Auer rods|
|
Flow cytometry |
Frequency (%) |
Total |
|
|---|---|---|---|
|
Positive |
Negative |
||
|
MPO ? Myeloperoxidase; CD ? Cluster differentiation |
|||
|
CD11b |
24 (25.3) |
71 (74.7) |
95 |
|
CD11c |
9 (9.7) |
84 (90.3) |
93 |
|
CD13 |
87 (87.9) |
12 (12.1) |
99 |
|
CD15 |
47 (50.0) |
47 (50.0) |
94 |
|
CD19 |
10 (12.8) |
68 (87.2) |
78 |
|
CD33 |
95 (95.0) |
5 (5.0) |
100 |
|
CD34 |
53 (54.6) |
44 (45.4) |
97 |
|
CD36a |
16 (18.6) |
70 (81.4) |
86 |
|
CD41 |
3 (3.2) |
91 (96.8) |
94 |
|
CD45 |
88 (88.9) |
11 (11.1) |
99 |
|
CD56 |
10 (11.6) |
76 (88.4) |
86 |
|
CD61 |
2 (2.1) |
92 (97.9) |
94 |
|
CD64 |
42 (48.8) |
44 (51.2) |
86 |
|
CD113 |
4 (4.7) |
81 (95.3) |
85 |
|
CD117 |
83 (83.8) |
16 (16.2) |
99 |
|
CD123 |
40 (46.0) |
47 (54.0) |
87 |
|
MPO |
97 (89.0) |
12 (11.0) |
109 |
|
Frequency (%) |
|
|---|---|
|
AMPL ? Acute promyelocytic leukemia |
|
|
t(15;17) |
57 (22.4) |
|
t(8;21) |
3 (1.2) |
|
Complex |
5 (2.0) |
|
Del 5 |
1 (0.4) |
|
Del 7 |
2 (0.8) |
|
AMPL variant |
4 (1.6) |
|
Normal |
24 (9.4) |
|
Trisomy 21 |
1 (0.4) |
|
Del 11 |
1 (0.4) |
|
t(11;12) |
1 (0.4) |
|
t(9;11) |
1 (0.4) |
|
Del 12 |
1 (0.4) |
|
Inv(16) |
3 (1.2) |
|
t(1;7) |
1 (0.4) |
|
Total |
105 (41.3) |
|
Unknown |
149 (58.7) |
|
Total |
254 (100.0) |
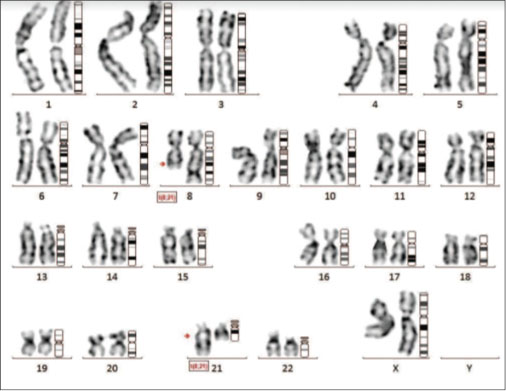
|?Figure. 3 (a)? Conventional karyotype revealing t(8;21)|
In our total of 254 patients, maximum patients were M3 phenotype, and around one-fourth of patients belonged to APML, proven by reverse transcription-polymerase chain reaction [Table 5]. To all patients of APML, the standard ICAPL-2006 protocol was used, with a dose of ATRA of 45 mg/m2. Treatment was individualized on the basis of risk, low or high risk, depending upon TLC count of less or more than10,000/?l, respectively. Hence, of 254 patients, 25% (64) patients were APML and 190 (75%) were non-M3, either phenotypically or non-t(15;17). Of 190 patients, only 127 (67%) patients received treatment. All non-M3 patients received standard treatment depending upon performance status and age. Only five patients received low-dose cytarabine, and rest 122 patients received standard 3:7 induction regimen. Cytarabine was given 200 mg/m2?for 7 days with daunorubicin at a dose of 45 mg/m2?or 60 mg/m2. Remission was assessed on average of day 45 of APML protocol and day 28 of 3:7 protocol [Table 8]. There was no difference in outcome in different doses of daunorubicin. Around 2.2% of APML patients were refractory to initial treatment induction, 1.6% succumbed during induction, and 16.0% of non-M3 did not achieve CR with 20.8% induction deaths. Of 97 patients of non-M3 phenotype, only 61 patients were available to high-dose cytosine arabinoside consolidation of 3 g/m2?[Table 9].
|
Phenotype |
Number of patients |
Treatment received |
No treatment received |
Percentage of patients |
Valid percentage |
CR status (%) |
|---|---|---|---|---|---|---|
|
CR ? Complete remission; APML ? Acute promyelocyte leukemia |
||||||
|
M3 or APML |
64 |
64 |
0 |
25 |
100 |
96.2 |
|
Non-M3 |
190 |
95 |
95 |
75 |
50 |
63.2 |
|
Number of Ara-C cycles in consolidation |
Number of patients available (%) |
Valid percentage |
|---|---|---|
|
3 cycles |
35 (13.8) |
50.0 |
|
4 cycles |
18 (7.1) |
33.1 |
|
<3> |
1 (0.4) |
1.4 |
|
Number of patients/ percentages |
Outcome |
Total |
P Value (Chi-square test) |
Odds Ratio (95% CI) |
|||
|---|---|---|---|---|---|---|---|
|
Alive |
Dead |
||||||
|
Age |
<10> |
Count |
7 |
7 |
14 |
<0> |
|
|
% within Age |
50.0% |
50.0% |
100.0% |
||||
|
11-20 years |
Count |
28 |
14 |
42 |
0.500 (0.146, 1.708) |
||
|
% within Age |
66.7% |
33.3% |
100.0% |
||||
|
|?Figure. 1? Study design|
|?Figure. 2 (a)? Promyelocytes with granular cytoplasm. (b) With Auer rods|
|?Figure. 3 (a)? Conventional karyotype revealing t(8;21)|
|?Figure. 4? Figure 4: Multivariate analysis revealing lowest hazard for acute promyelocytic leukemia (M3)
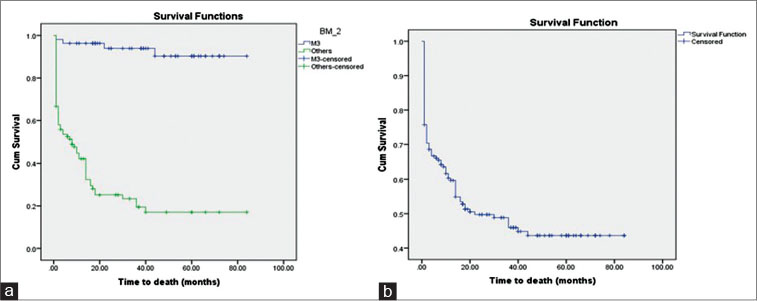
|?Figure. 5? Overall survival curve with 87% and 16% survival at 80 months for M3 and non-M3 types, respectively. (b) Overall survival was 40% at 80 months
| |||||||