 PDF
PDF  Views
Views  Share
Share


Elevated p63 Expression as an Indicator for Poorer Prognosis in Squamous Cell Carcinomas of the Oral Cavity: An Immunohistochemical Study
CC BY-NC-ND 4.0 ? Indian J Med Paediatr Oncol 2018; 39(02): 146-152
DOI: DOI: 10.4103/ijmpo.ijmpo_69_17
Abstract
Background:?Oral cancer remains one of the most debilitating and disfiguring of all malignancies. The survival rates for oral cancer vary, depending on several factors. Although p63 is an accepted prognostic marker in various other carcinomas, no consensus has been obtained till date regarding the applicability of p63 as a prognostic marker in head and neck squamous cell carcinomas (SCC).?Aim and Objectives:?The present study was conducted to determine the applicability of p63 as a prognostic marker in oral squamous cell carcinomas (OSCC) using incisional biopsies.?Materials and Methods:?Incisional biopsies of 27 candidates who were histopathologically diagnosed with SCC (8070/3) of the oral cavity (C06.9) (OSCC) between January 2013 and June 2014 were included in the trial. Sections were subjected to immunohistochemistry with p63 as the primary antibody. The percentage p63 expression was calculated and compared based on their Broders' and Anneroth's multifactorial grading systems with the overall survival status of the patients.?Results and Observations:?A statistically significant increase (P?= 0.0203) was found between p63 expression and the histological grading of the tumor (from Grade I OSCC to Grade III OSCC). Similarly, a statistically significant correlation (P?= 0.013) was obtained between mean Anneroth score (MAS) and the Broders' grading. Log-rank (Mantel-Cox) test showed statistical significance for the survival curves when the candidates were classified based on % p63 [removed]P?= 0.0049) and MAS (P?= 0.0003).?Conclusion:?We have shown expression of p63 to correlate with survival in OSCCs, where high expression was seen in tumors with poorer survival after treatment. Furthermore, the usage and importance of Anneroth's multifactorial grading system over Broders' grading system in routine histopathological reporting for incisional biopsies of OSCCs is stressed.
Keywords
Carcinoma - human - immunohistochemistry - prognosis - squamous cell of the head and neck - TP63 proteinPublication History
Article published online:
23 June 2021
? 2018. Indian Society of Medical and Paediatric Oncology. This is an open access article published by Thieme under the terms of the Creative Commons Attribution-NonDerivative-NonCommercial-License, permitting copying and reproduction so long as the original work is given appropriate credit. Contents may not be used for commercial purposes, or adapted, remixed, transformed or built upon. (https://creativecommons.org/licenses/by-nc-nd/4.0/.)
Thieme Medical and Scientific Publishers Pvt. Ltd.
A-12, 2nd Floor, Sector 2, Noida-201301 UP, India
Abstract
Background:?Oral cancer remains one of the most debilitating and disfiguring of all malignancies. The survival rates for oral cancer vary, depending on several factors. Although p63 is an accepted prognostic marker in various other carcinomas, no consensus has been obtained till date regarding the applicability of p63 as a prognostic marker in head and neck squamous cell carcinomas (SCC).?Aim and Objectives:?The present study was conducted to determine the applicability of p63 as a prognostic marker in oral squamous cell carcinomas (OSCC) using incisional biopsies.?Materials and Methods:?Incisional biopsies of 27 candidates who were histopathologically diagnosed with SCC (8070/3) of the oral cavity (C06.9) (OSCC) between January 2013 and June 2014 were included in the trial. Sections were subjected to immunohistochemistry with p63 as the primary antibody. The percentage p63 expression was calculated and compared based on their Broders' and Anneroth's multifactorial grading systems with the overall survival status of the patients.?Results and Observations:?A statistically significant increase (P?= 0.0203) was found between p63 expression and the histological grading of the tumor (from Grade I OSCC to Grade III OSCC). Similarly, a statistically significant correlation (P?= 0.013) was obtained between mean Anneroth score (MAS) and the Broders' grading. Log-rank (Mantel-Cox) test showed statistical significance for the survival curves when the candidates were classified based on % p63 [removed]P?= 0.0049) and MAS (P?= 0.0003).?Conclusion:?We have shown expression of p63 to correlate with survival in OSCCs, where high expression was seen in tumors with poorer survival after treatment. Furthermore, the usage and importance of Anneroth's multifactorial grading system over Broders' grading system in routine histopathological reporting for incisional biopsies of OSCCs is stressed.
Keywords
Carcinoma - human - immunohistochemistry - prognosis - squamous cell of the head and neck - TP63 proteinIntroduction
Oral cancer remains one of the most debilitating and disfiguring of all malignancies. Our knowledge on the prevention and treatment of cancer is increasing, yet the number of new cases grows every year.[1] The survival rates for oral cancer vary, depending on several factors: the stage of the lesion, the site of the primary tumor, the adequacy of initial treatment, and the histological differentiation of the malignancy.[2] Oral carcinogenesis is a highly complex multifocal process that takes place when squamous epithelium is affected by several genetic alterations.[3] In recent years, considerable progress has been made in understanding the genetic basis of the development of oral squamous cell carcinoma (OSCC). Alterations of the p53 tumor suppressor gene are the most frequently documented genetic abnormalities in human cancer, especially OSCC.[4] p53 belongs to a family which includes p63 and p73, which are expected to play a role in cancer development due to their close homology to p53. A large data collected over the years have indicated that altered expression of p63 and p73 could be found in different neoplasia and play a role in its biology.[5]
Since p63, in tumorigenesis, is attributed to various roles such as, apoptosis,[6] cellular senescence,[7] tumor suppression,[6] interplay with NOTCH pathways,[8] cellular proliferation [7] and oncogenetic properties,[5],[6] due to the diversity in the gene structure,[9] and availability of numerous isoforms,[6] studies conducted on the applicability of p63 as a prognostic marker has delivered varied, contrasting results in different types of cancers.
Although p63 is an accepted prognostic marker in various other carcinomas, no consensus has been obtained till date regarding the applicability of p63 as a prognostic marker in head and neck squamous cell carcinomas (SCC).[5]
Hence, the present study was conducted to determine the applicability of p63 as a prognostic marker in OSCC using incisional biopsies and aid to mitigate the overall effect of various isoforms of p63 in the pathogenesis of OSCCs.
Materials and Methods
The present study was duly cleared for implementation by the University Ethical Committee, and an informed consent was obtained from all the candidates included in the study.
Twenty-seven candidates who were histopathologically diagnosed with SCC (8070/3) of the oral cavity (C06.9) between January 2013 and June 2014 and decided to undergo treatment for the disease in our center were included in the trial. This sample excluded patients in whom mortality was encountered due to intra- and post-operative complications of surgery, history of other systemic/immunodeficiency disorders, and recurrent cases of OSCC.
Formalin-fixed paraffin-embedded (FFPE) tissue blocks of the incisional biopsies of all the 27 included candidates were retrieved from the pathology archives, and fresh H and E-stained sections were interpreted by three qualified pathologists for confirmation of the histological grade of OSCC as per Broders' classification [10] and calculation of the mean Anneroth score (MAS) based on the morphological (degree of keratinization, nuclear pleomorphism, number of mitotic figures per high power field [HPF]), and histological (pattern of invasion, stage of invasion, and lymphoplasmacytic infiltrate) scoring parameters of Anneroth's multifactorial grading system.[11] The various clinicopathological variables of the included study candidates have been tabulated in [Table 1].
|
Variables in study candidates |
Number of cases (%) |
|---|---|
|
OSCC ? Oral squamous cell carcinoma; NOS ? Not otherwise specified; ADf ? Alive, disease free; AwD ? Alive, with disease; DoD ? Dead of disease: DoC ? Dead of any other cause; S + RT ? Surgery + postoperative radiotherapy; TNM ? Tumor, node, and metastasis |
|
|
Sample size (OSCC) |
27 |
|
Age (years) |
|
|
10-19 |
1 (3.7) |
|
30-39 |
4 (14.81) |
|
40-49 |
5 (18.51) |
|
50-59 |
10 (37.03) |
|
60-69 |
6 (22.22) |
|
70-79 |
1 (3.7) |
|
Sex |
|
|
Male |
21 (77.77) |
|
Female |
6 (22.22) |
|
Site |
|
|
Oral cavity, NOS (C06.9) |
27 |
|
Cheek mucosa (C06.0) |
19 (70.37) |
|
Gum (C03.9) |
5 (18.51) |
|
Dorsal surface of tongue (C02.0) |
3 (11) |
|
TNM staging |
|
|
Stage II (pT2N0M0) |
12 (44.44) |
|
Stage III (pT3N0M0) |
6 (22.22) |
|
Stage III (pT2NjM0) |
4 (14.81) |
|
Stage III (pT3NjM0) |
5 (18.51) |
|
Treatment protocol |
|
|
S alone |
20 (74.07) |
|
S + RT |
7 (25.93) |
|
Broders? classification |
|
|
Grade I (well-differentiated OSCC) |
10 (37.03) |
|
Grade II (moderately differentiated |
10 (37.03) |
|
OSCC) |
|
|
Grade III (poorly differentiated |
7 (25.93) |
|
OSCC) |
|
|
Anneroth?s multifactorial grading system |
|
|
Mean Anneroth score (<2> |
14 (51.85) |
|
Mean Anneroth score (2.6-4.0) |
13 (48.15) |
|
Percentage p63 expression |
|
|
<50> |
5 (18.52) |
|
50%-75% |
9 (33.33) |
|
>75% |
13 (48.15) |
|
Status at end date |
|
|
ADf |
15 (55) |
|
AwD |
Nil |
|
DoD |
12 (45) |
|
DoC |
Nil |
|
Follow-up period (days) |
|
|
Range |
121-949 |
|
Mean |
479.15 |
|
Case number |
Age/sex |
Broders? classification |
Mean Anneroth score |
TNM staging |
Treatment protocol |
Percentage p63 expression |
Follow-up (days) |
Survival status |
|---|---|---|---|---|---|---|---|---|
|
ADf ? Alive, disease free; DoD ? Dead of disease; SCC ? Squamous cell carcinoma; S + RT ? Surgery + postoperative radiotherapy; TNM ? Tumor, node, and metastasis |
||||||||
|
1 |
60/female |
Grade I SCC |
1.6667 |
Stage II (pT2N0M0) |
S |
42.4513 |
949 |
ADf |
|
2 |
52/male |
Grade I SCC |
2.3333 |
Stage III ^NM,) |
S |
46.0377 |
942 |
ADf |
|
3 |
65/male |
Grade I SCC |
2.6667 |
Stage III (pT3N1M0) |
S |
87.9194 |
322 |
DoD |
|
4 |
39/male |
Grade I SCC |
1.8333 |
Stage II (pT2N0M0) |
S |
58.3756 |
926 |
ADf |
|
5 |
50/male |
Grade I SCC |
2.6667 |
Stage III (p^NM |
S + RT |
72.2599 |
128 |
DoD |
|
6 |
45/male |
Grade I SCC |
2 |
Stage II (pT2N0M0) |
S |
37.4057 |
735 |
ADf |
|
7 |
32/male |
Grade I SCC |
2.1667 |
Stage II (pT2N0M0) |
S |
52.9182 |
460 |
ADf |
|
8 |
58/female |
Grade I SCC |
2.3333 |
Stage II (pT2N0M0) |
S |
79.1411 |
279 |
DoD |
|
9 |
40/male |
Grade I SCC |
1.8333 |
Stage III ^NM,) |
S + RT |
49.6977 |
856 |
ADf |
|
10 |
50/female |
Grade I SCC |
2.3333 |
Stage III (p^NM |
S |
34.3103 |
772 |
ADf |
|
11 |
60/male |
Grade II SCC |
2.1667 |
Stage III (pT3N,M,) |
S |
70.3557 |
874 |
ADf |
|
12 |
34/male |
Grade II SCC |
2.8333 |
Stage III (p^NM |
S |
83.5924 |
179 |
DoD |
|
13 |
30/male |
Grade II SCC |
1.6667 |
Stage II (pT2N0M0) |
S |
61.4661 |
543 |
ADf |
|
14 |
60/Male |
Grade II SCC |
2.6667 |
Stage III (pT^M,) |
S + RT |
77.9951 |
168 |
DoD |
|
15 |
71/female |
Grade II SCC |
2.1667 |
Stage II (pT2N0M0) |
S |
81.7857 |
338 |
DoD |
|
16 |
41/male |
Grade II SCC |
3.6667 |
Stage II (pT2N0M0) |
S |
74.3065 |
298 |
DoD |
|
17 |
48/male |
Grade II SCC |
2.8333 |
Stage III (pT^M,) |
S + RT |
72.1297 |
523 |
ADf |
|
18 |
61/male |
Grade II SCC |
2.5 |
Stage II (pT2N0M0) |
S |
78.8359 |
460 |
ADf |
|
19 |
56/male |
Grade II SCC |
2 |
Stage II (pT2N0M0) |
S |
67.1755 |
502 |
ADf |
|
20 |
19/male |
Grade II SCC |
2.6667 |
Stage III (p^NM |
S + RT |
75.2562 |
462 |
ADf |
|
21 |
45/female |
Grade III SCC |
3.5 |
Stage III (p^NM |
S |
83.087 |
225 |
DoD |
|
22 |
55/male |
Grade III SCC |
3 |
Stage II (pT2N0M0) |
S |
86.0549 |
194 |
DoD |
|
23 |
50/male |
Grade III SCC |
2.6667 |
Stage III (p^NM |
S |
91.7867 |
141 |
DoD |
|
24 |
55/male |
Grade III SCC |
3.1667 |
Stage III (pT2N1M0) |
S + RT |
87.7478 |
820 |
ADf |
|
25 |
60/male |
Grade III SCC |
2.8333 |
Stage III (pT^M,) |
S + RT |
87.0114 |
121 |
DoD |
|
26 |
50/female |
Grade III SCC |
2.1667 |
Stage II (pT2N0M0) |
S |
61.2959 |
510 |
ADf |
|
27 |
55/male |
Grade III SCC |
3 |
Stage III (p^NM |
S |
83.2356 |
210 |
DoD |
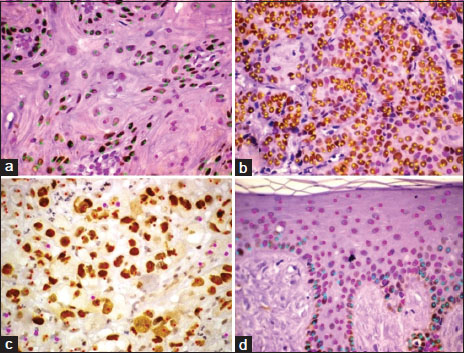
|?Figure.1p63 expression in (a) Grade I oral squamous cell carcinoma, (b) Grade II oral squamous cell carcinoma, (c) Grade III oral squamous cell carcinoma, (d) Normal oral mucosa (immunoperoxidase, original magnification ?400)
p63 expression in squamous cell carcinomas of the oral cavity
Various staining patterns were observed for p63 expression in OSCCs. It was observed that the pattern of staining differs between the grading of neoplasms. Grade I neoplasms [Figure 1]a showed a varied range of p63 [removed]range: 34.31%?87.91%; mean = 56.05%). In Grade II neoplasms [Figure 1]b, the mean % p63 expression was higher when compared to Grade I OSCCs (mean: 74.29%; range: 61.47?83.6%) and lesser when compared to poorly differentiated neoplasms (Group III) [Figure 1]c which showed the most intense and diffuse labeling (mean: 82.89%; range: 61.29%?91.79%) [Table 2]. Staining for p63 was not detected in the keratin pearl areas in both Grade I and Grade II neoplasms.
A statistically significant correlation (P?= 0.0203) was found between p63 expression and the histological grading of the tumor; in fact, the percentage of cells expressing p63 was lower in well-differentiated tumors (Grade I) with respect to poorly differentiated tumors (Grade III) [Table 3].
|
Factor analyzed |
Grade I SCC (n=10) |
Grade II SCC (n=10) |
Grade III SCC (n=07) |
Normal oral mucosa (n=10) |
One-way ANOVA (P) |
Tukey?s multiple comparison test |
|---|---|---|---|---|---|---|
|
SCC ? Squamous cell carcinoma |
||||||
|
Mean Anneroth score (mean) |
2.1833 |
2.5167 |
2.9047 |
Not applicable |
0.013 |
P<0> |
|
Percentage p63 [removed]mean) |
56.0517 |
74.2899 |
82.8885 |
20.8655 |
0.0203 |
P<0> |
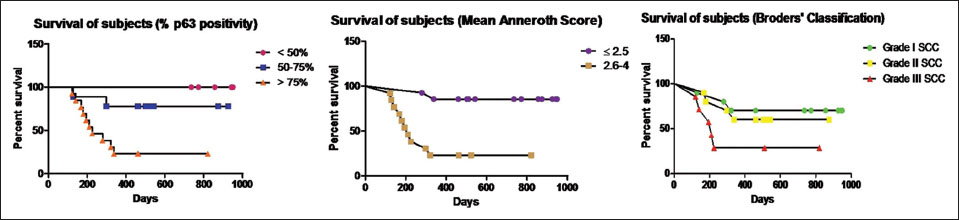
|?Figure.2Kaplan?Meier survival curves based on various criteria of classification
Similarly, the patients with higher MAS (MAS = 2.6?4) had poorer survival rates when compared to the patients with lesser MAS (MAS ?2.5). Among patients with MAS ?2.5 (14/27), the survival proportion was 85.71 after 949 days of follow-up whereas data of patients with MAS = 2.6?4 showed a comparatively lower survival proportion of 23.07 after 820 days of maximum follow-up. The statistical comparison of the survival curves was done by log-rank (Mantel-Cox) test which showed statistical significance (P?= 0.0003) between the survival curves of patients with MAS ?2.5 and MAS = 2.6?4 [Figure 2].
On the contrary, when the tumors were classified based on Broders' classification, although the survival proportion of poorly differentiated (Grade III) tumors (28.57 after 820 days) was comparatively lower than the moderately (Grade II) (60.00 after 874 days) and well-differentiated (Grade I) neoplasms (70.00 after 949 days), the statistical comparison of the survival curves (log-rank [Mantel-Cox] test) showed no statistical significance (P?= 0.1016) [Figure 2].
Moreover, when the mean and standard error of mean (X ? SEM) of the percentage p63 expression of the study participants classified based on their survival period following diagnosis, it was observed that there was a statistically significant increase (P?= 0.0004) in the mean % p63 expression of patients with <479>479 days' survival (Grade I SCC = 45.89 ? 3.228; Grade II SCC = 70.87 ? 2.494). In Grade III SCC participants, although there was an increase in the mean % p63 expression in participants with <479>479 days of survival (74.52 ? 13.23), no statistical significance was obtained [Table 4].