 PDF
PDF  Views
Views  Share
Share


Epidemiology of Cancer Incidence Estimates and Statistics 2000–2025: Analysis from National Cancer Registry Programme in India
CC BY 4.0 · Indian J Med Paediatr Oncol 2025; 46(03): 278-287
DOI: DOI: 10.1055/s-0044-1801767
Abstract
Introduction Several hospital-based and population-based cancer registries (PBCRs) have been collecting cancer data systematically since 1982, according to the National Cancer Registry Programme-National Centre for Disease Informatics and Research, an initiative of the Indian Council of Medical Research.
Objective Planning, observing, and assessing cancer control efforts require knowledge of current cancer statistics. This article's goal is to provide an update on cancer incidence projections for India by age groups, sex, and anatomical sites for the period 2020 to 2025.
Materials and Methods The cancer incidence, patterns, trends, projections, and mortality from 28 PBCRs were analyzed in this study, along with the kind of therapy and stage of presentation of cancer patients from 58 HBCRs (N = 667,666) from the pooled analysis for the composite period 2012 to 2016. Data regarding the population at risk were obtained from the Indian Census (2001 and 2011) to estimate the age- and sex-stratified population. To gain a better understanding of the epidemiology of cancer, the states and areas of the nation were divided into PBCR groups.
Results For both males and females, the districts with the highest age-adjusted incidence rates were Aizawl (269.4) and Papum Pare (219.8). It is anticipated that there will be 1392,179 cancer patients in India by 2020 and 1569,793 by 2025. In Delhi, the northern region of India, the incidence rates of tobacco-related malignancies were high (62.1% for men and 18.5% for women). High incidence rates were seen in the southern districts of Kollam (males: 52.9) and Bangalore (20.1), respectively. Age-adjusted rates (AARs) for males and females in Kolkata, East, were 42.3 and 13.7, respectively. Western cities with high AARs were Mumbai (18.2) and Ahmedabad Urban (54.3) for men and women, respectively. For lung cancer, in terms of male and female incidence rates, Aizawl district ranked highest at 38.8 and 37.9 per 100,000, respectively.
Conclusion This study offers a methodology for evaluating cancer trends and status in India. To meet the national targets for noncommunicable diseases and the sustainable development goals, it will direct adequate support for action to boost efforts to promote cancer prevention and control.
Keywords
cancer incidence - lung cancer - breast cancer - tobacco-related cancer - relative proportionPublication History
Article published online:
04 February 2025
© 2025. The Author(s). This is an open access article published by Thieme under the terms of the Creative Commons Attribution License, permitting unrestricted use, distribution, and reproduction so long as the original work is properly cited. (https://creativecommons.org/licenses/by/4.0/)
Thieme Medical and Scientific Publishers Pvt. Ltd.
A-12, 2nd Floor, Sector 2, Noida-201301 UP, India
- Ecological Analysis to Study Association between Prevalence of Smokeless Tobacco Type and Head-and-Neck CancerDevyani Dilip Gholap, Indian Journal of Medical and Paediatric Oncology, 2018
- Incidence and Pattern of Childhood Cancers in India: Findings from Population-based Cancer RegistriesMD Abu Bashar, Indian Journal of Medical and Paediatric Oncology, 2017
- Tobacco-related cancers in India: A review of incidence reported from population-based cancer registriesSmita Asthana, Indian Journal of Medical and Paediatric Oncology, 2016
- Trends in gallbladder cancer incidence in the high- and low-risk regions of IndiaPrachi Ravindra Phadke, Indian Journal of Medical and Paediatric Oncology, 2019
- Incidence and Trends of Breast and Cervical Cancers: A Joinpoint Regression AnalysisSatyanarayana Labani, Indian Journal of Medical and Paediatric Oncology, 2020
- Incidence and mortality of cervical cancer in China in 2015<svg viewBox="0 0 24 24" fill="none" xmlns="http://www.w3.org/2000/svg">
- Incidence and mortality of cervical cancer in China in 2015<svg viewBox="0 0 24 24" fill="none" xmlns="http://www.w3.org/2000/svg">
- Patterns and trends in esophageal cancer incidence and mortality in China: An analysis based on cancer registry data<svg viewBox="0 0 24 24" fill="none" xmlns="http://www.w3.org/2000/svg">
- Cancer incidence and mortality in China, 2016<svg viewBox="0 0 24 24" fill="none" xmlns="http://www.w3.org/2000/svg">
- Nowcasting and forecasting global aging and cancer burden: analysis of data from the GLOBOCAN and Global Burden of Disease Study<svg viewBox="0 0 24 24" fill="none" xmlns="http://www.w3.org/2000/svg">
Abstract
Introduction Several hospital-based and population-based cancer registries (PBCRs) have been collecting cancer data systematically since 1982, according to the National Cancer Registry Programme-National Centre for Disease Informatics and Research, an initiative of the Indian Council of Medical Research.
Objective Planning, observing, and assessing cancer control efforts require knowledge of current cancer statistics. This article's goal is to provide an update on cancer incidence projections for India by age groups, sex, and anatomical sites for the period 2020 to 2025.
Materials and Methods The cancer incidence, patterns, trends, projections, and mortality from 28 PBCRs were analyzed in this study, along with the kind of therapy and stage of presentation of cancer patients from 58 HBCRs (N = 667,666) from the pooled analysis for the composite period 2012 to 2016. Data regarding the population at risk were obtained from the Indian Census (2001 and 2011) to estimate the age- and sex-stratified population. To gain a better understanding of the epidemiology of cancer, the states and areas of the nation were divided into PBCR groups.
Results For both males and females, the districts with the highest age-adjusted incidence rates were Aizawl (269.4) and Papum Pare (219.8). It is anticipated that there will be 1392,179 cancer patients in India by 2020 and 1569,793 by 2025. In Delhi, the northern region of India, the incidence rates of tobacco-related malignancies were high (62.1% for men and 18.5% for women). High incidence rates were seen in the southern districts of Kollam (males: 52.9) and Bangalore (20.1), respectively. Age-adjusted rates (AARs) for males and females in Kolkata, East, were 42.3 and 13.7, respectively. Western cities with high AARs were Mumbai (18.2) and Ahmedabad Urban (54.3) for men and women, respectively. For lung cancer, in terms of male and female incidence rates, Aizawl district ranked highest at 38.8 and 37.9 per 100,000, respectively.
Conclusion This study offers a methodology for evaluating cancer trends and status in India. To meet the national targets for noncommunicable diseases and the sustainable development goals, it will direct adequate support for action to boost efforts to promote cancer prevention and control.
Keywords
cancer incidence - lung cancer - breast cancer - tobacco-related cancer - relative proportionIntroduction
Nowadays, one of the main causes of sickness and death worldwide is cancer, which is also a health concern. An estimated 70% increase in cancer incidence is predicted in the next 20 years, despite continuous global efforts to prevent cancer.[1] Noncommunicable diseases (NCDs) accounted for 71% of all fatalities worldwide.[2] According to estimates, NCDs caused 63% of deaths in India, with cancer being among the top causes (9%). It is acknowledged that cancer registries are essential parts of national initiatives to manage cancer.[3] Current data on cancer incidence, trends, and projections can be found in publications from both industrialized and developing nations. Many National Cancer Registry Programme (NCRP) cancer reports from various Indian registries have been made public.[4] [5] [6] Nearly half of the world's cancer cases and over half of cancer-related deaths occur in Asian nations, according to the GLOBOCAN 2018 database.[7] Research from both domestic and international sources indicates that the Indian subcontinent has seen a marked rise in the incidence, morbidity, and death related to cancer.[8] [9] [10] [11] [12]
In a population that is characterized by geography, population-based cancer registries (PBCRs) offer data on the incidence and prognosis of cancer. In addition, they offer the structure for evaluating community cancer control. The main applications of HBCRs are performance reviews of clinical trials and hospital cancer programs, which deal with the documentation of data on cancer patients seen in a specific hospital. The PBCR now serves a purpose besides only providing data on the prevalence of cancer in a certain catchment region.[13] The Indian Council of Medical Research (ICMR) program report 2020 predicts that, given present trends, there will be 13.9 lakh cancer cases in the country in 2020 and that number is likely to increase to 15.7 lakh by 2025. These approximations are derived from cancer-related data gathered from 28 PBCRs. Additionally, information on cancer was provided by 58 hospital-based cancer registries (HBCRs). There will be 3.7 lakh (27.1%) tobacco-related cancer cases worldwide in 2020, according to estimates. Among women, breast cancer accounts for an estimated 2.0 lakh cases (14.8%), whereas cervical cancer accounts for 0.75 lakh occurrences (5.4%). Gastrointestinal tract malignancies account for an estimated 2.7 lakhs (19.7%) of all cancer cases, affecting both men and women. The incidence of cancer per 100,000 people in the male population varies from 269.4 in Aizawl district (the highest in India) to 39.5 in Osmanabad and Beed district. Comparably, the incidence of cancer in female populations varies from 219.8 cases per 100,000 people in the Papum Pare district to 49.4 cases in the Osmanabad and Beed areas. Roughly 94,000 new cases of cervical cancer are expected to occur annually in India alone, where it accounts for 7.92% of all malignancies diagnosed in women globally.[14] [15] Breast cancer cases in Indian women have been discovered to be 10 years younger than in Western women, indicating that breast cancer develops earlier in premenopausal life in India.[16] [17] [18] [19]
Materials and Methods
Materials
Under the ICMR-NCDIR-NCRP (ICMR-National Centre for Disease Informatics and Research-NCRP), there are now 236 HBCRs and 36 PBCRs registered. However, this article contains data from 58 HBCRs and 28 PBCRs that have at least a year's worth of high-quality data. Both during and after data submission, the registration data are subjected to multiple quality checks. These include range, consistency, and family checks in accordance with the guidelines set forth by the International Association of Cancer Registries. Both the web-based PBCR data entry application and PBCRDM 2.1 include all the checks. After the changes are received, the registry database is updated with the list of instances that may have been incorrectly sent to the relevant registries for verification using the original medical records. The NCDIR-NCRP greatly facilitates cancer registration with innovative software applications. The desktop and web-based PBCR software performs quality checks (including consistency, range, improbable, and family), matching, and duplicate checks to ensure that the data are accurate and legitimate. Furthermore, duplicate names that sound similar but have different spellings are filtered out using a phonetics program. The software is used to identify fluctuations in the number of cancer cases over time from each source of registration so that the appropriate action can be taken. When mortality data and incidence are matched, the unmatched mortality cases are classified as either death certification only or death certificate notification. After obtaining clarification from each registry at each stage, the data are finalized and ready for further analysis.
Methods
Study Design
Secondary data from HBCRs and PBCRs were used in the study.
Primary and Secondary Outcomes
This study's primary outcome is to estimate India's cancer incidence utilizing HBCRs and PBCRs. The estimation of cancer cases projected for 2025 using age-specific incidence rate is the secondary outcome.
Statistical Analysis
The following formulas are used to compute the crude incidence rate, age-specific rate (ASpR), age-standardized rate, cumulative risk, and truncated age-adjusted incidence rate for the obtained data. The statistical software Joinpoint Regression Program, Version 4.7.0, is used to analyze trends using Joinpoint models, which are regression lines that are connected at many locations. In this article, the population estimates for the years 2012 and 2016 were computed using the difference distribution method (which estimates populations by five annual age groups) using data from the censuses of 2001 and 2011. The number of cancer cases in India for 2024 was then calculated by applying the age-standardized incidence rate (ASIR) of each distinct anatomical site for the years 2012 to 2016 to the predicted population. The total estimate of all site cancer was obtained by adding the cancer estimates for each individual anatomical site (International Classification of Diseases, Tenth Revision [ICD-10]: C00–C97). Utilizing the population-weighted average of the rates from the PBCRs, the pooled age, sex, and site-specific incidence rates were calculated. The 28 PBCRs were assumed to be representative of the nation with a steady incidence rate throughout time for the purpose of estimating the incidence of cancer.
Ethical Approval
This study received ethical approval from the Institutional Ethics Committee (IEC) of the National Centre for Disease Informatics and Research (NCDIR) under reference number NCDIR/IEC/3020/2020. Participating Population-Based and Hospital-Based Cancer Registries also obtained approval from their respective Ethics Committees and secured consent from local authorities, citizen groups, and community representatives.
Crude Incidence Rate
Crude rate (CR) is the rate found by dividing the total number of cancer cases by the corresponding mid-year population estimate and then multiplying the result by 100,000.

| Fig 1 :
Age-Specific Rate
ASpR is the rate determined by dividing the total number of cancer cases by the estimated population in that age group, gender, site, geographic area, and time, then multiplying the result by 100,000.

| Figure 2:
Age-Standardized Rate
Cancer incidence increases as age increases. Accordingly, the number of cancer cases increases with the percentage of the population that is older. The proportion of older people is higher in most developed and Western countries. Hence, age-adjusted rate (AAR) or age-standardized rate are calculated using a world standard population that accounts for this to make cancer rates comparable between nations. By collecting the ASpRs and applying them to the standard population in that age group, this is estimated using the direct technique[20] (Boyle and Parkin, 1991).

| Figure 3:
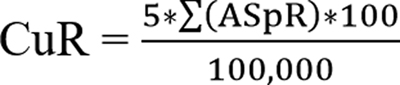
Cumulative Risk
The probability that a person would acquire a specific cancer at a given age, barring any other cause of death, is known as cumulative risk. An approximation of the cumulative risk is the cumulative rate (CuR). It is calculated by multiplying the yearly age-specific incidence rates by 5 (the 5-year age interval), times 100/100,000. This process is repeated for each 5-year age interval, up to 64 or 74 years of age, or for whatever age group is to be used to compute the cumulative risk.
| Figure 4:
Truncated Age-Adjusted Incidence Rate
This is similar to the age-adjusted rate, with the exception that it is based on a reduced age range of 35 to 64.
Results
Calculation of Cancer Incidence
The number of men and women covered by PBCRs is provided using data from 32 geographic locations. There are 865 girls for every 1,000 males in Mumbai PBCR, which has the lowest sex ratio in the data. In comparison to other PBCRs, the percentage of rural residents reporting was higher in the northeastern (NE) PBCRs. There are 12 pure urban PBCRs, 1 pure rural PBCR, and 15 PBCRs that cover the populations of both urban and rural areas in varying percentages. [Table 1] shows that the top five PBCRs with the highest number of cases registered were Thiruvananthapuram district (27,833), Bangalore (29,049), Chennai (31,271), Delhi (60,097), and Mumbai (53,714). With the exception of Manipur, Imphal West district, and Papum Pare district in Arunachal Pradesh, the majority of registries in the NE region of the country showed a greater percentage of cancer cases in men. Except for Delhi, the Kollam district, Kolkata, and Ahmedabad urban, there were more female cancer cases reported in other places.
|
S. No |
Registry |
Males |
Females |
Total |
||
|---|---|---|---|---|---|---|
|
NORTH |
||||||
|
n |
% |
n |
% |
N |
||
|
1 |
Delhi (2012–14) |
31,032 |
51.6 |
29,065 |
48.4 |
60,097 |
|
2 |
Patiala (2012–16) |
5,394 |
47.0 |
6,077 |
53 |
11,471 |
|
SOUTH |
||||||
|
3 |
Hyderabad (2012–14) |
5,143 |
44.4 |
6,453 |
55.6 |
11,596 |
|
4 |
Kollam (2012–16) |
9,930 |
50.4 |
9,780 |
49.6 |
19,710 |
|
5 |
Thiruvananthapuram (2012–16) |
13,506 |
48.5 |
14,327 |
51.5 |
27,833 |
|
6 |
Bangalore (2012–14) |
13,221 |
45.5 |
15,828 |
54.5 |
29,049 |
|
7 |
Chennai (2012–14) |
14,468 |
46.3 |
16,803 |
53.7 |
31,271 |
|
EAST |
||||||
|
8 |
Kolkata (2012–2015) |
10,186 |
52.7 |
9,151 |
47.3 |
19,337 |
|
WEST |
||||||
|
9 |
Ahmedabad urban (2012–2016) |
14,579 |
56.9 |
11,025 |
43.1 |
25,604 |
|
10 |
Aurangabad (2012–2016) |
1,923 |
49.0 |
2,001 |
51.0 |
3,924 |
|
11 |
Osmanabad and Beed (2012–2015) |
3,635 |
44.9 |
4,467 |
55.1 |
8,102 |
|
12 |
Barshi rural (2012–2016) |
726 |
47.2 |
813 |
52.8 |
1,539 |
|
13 |
Mumbai (2012–2015) |
26,256 |
48.9 |
27,458 |
51.1 |
53,714 |
|
14 |
Pune (2012–2016) |
9,687 |
47.2 |
10,818 |
52.8 |
20,505 |
|
CENTRAL |
||||||
|
15 |
Wardha district (2012–2016) |
2,389 |
48.5 |
2,537 |
51.5 |
4,926 |
|
16 |
Bhopal (2012–2015) |
3,567 |
49.8 |
3,589 |
50.2 |
7,156 |
|
17 |
Nagpur (2012–2016) |
5,952 |
49.6 |
6,047 |
50.4 |
11,999 |
|
NORTHEAST |
||||||
|
18 |
Manipur state (2012–2016) |
3,702 |
45.1 |
4,500 |
54.9 |
8,202 |
|
19 |
Mizoram state (2012–2016) |
4,323 |
53.6 |
3,736 |
46.4 |
8,059 |
|
20 |
Sikkim state (2012–2016) |
1,172 |
50.9 |
1,131 |
49.1 |
2,303 |
|
21 |
Tripura state (2012–2016) |
6,559 |
57.2 |
4,914 |
42.8 |
11,473 |
|
22 |
West Arunachal (2012–2016) |
1,222 |
51.1 |
1,171 |
48.9 |
2,393 |
|
23 |
Meghalaya (2012–2016) |
4,688 |
62.3 |
2,832 |
37.7 |
7,520 |
|
24 |
Nagaland (2012–2016) |
1,403 |
58.6 |
992 |
41.4 |
2,395 |
|
25 |
Pasighat (2012–2016) |
321 |
51.4 |
303 |
48.6 |
624 |
|
26 |
Cachar district (2012–2016) |
4,663 |
54.2 |
3,943 |
45.8 |
8,606 |
|
27 |
Dibrugarh district (2012–2016 |
2,535 |
53.1 |
2,238 |
46.9 |
4,773 |
|
28 |
Kamrup urban (2012–2016) |
6,223 |
56.5 |
4,790 |
43.5 |
11,013 |
|
S. No |
Registry |
Males |
Females |
||||
|---|---|---|---|---|---|---|---|
|
CR |
ARR |
TR |
CR |
ARR |
TR |
||
|
NORTH |
|||||||
|
1 |
Delhi (2012–2014) |
112.3 |
147.0 |
232.2 |
119.6 |
141.0 |
279.0 |
|
2 |
Patiala district (2012–2016) |
101.6 |
108.2 |
196.4 |
127.7 |
124.6 |
271.4 |
|
SOUTH |
|||||||
|
3 |
Hyderabad district (2014–2016) |
84.2 |
101.6 |
172.2 |
109.8 |
136.0 |
278.3 |
|
4 |
Kollam district (2012–2016) |
159.4 |
127.7 |
198.0 |
139.1 |
107.1 |
205.7 |
|
5 |
Thiruvananthapuram district (2012–2016) |
170.4 |
137.8 |
211.5 |
164.8 |
127.3 |
242.8 |
|
6 |
Bangalore (2012–2014) |
96.8 |
122.1 |
181.7 |
125.1 |
146.8 |
283.6 |
|
7 |
Chennai (2012–2016) |
121.8 |
119.9 |
185.2 |
141.4 |
132.8 |
260.5 |
|
EAST |
|||||||
|
8 |
Kolkata (2012–2015) |
109.9 |
91.2 |
145.2 |
105.9 |
89.2 |
175.9 |
|
WEST |
|||||||
|
9 |
Ahmedabad urban (2012–2016) |
89.1 |
98.3 |
183.2 |
74.7 |
76.7 |
158.0 |
|
10 |
Aurangabad (2012–2016) |
56.6 |
70.9 |
121.6 |
62.9 |
75.1 |
158.5 |
|
11 |
Osmanabad and Beed (2012–2015) |
39.3 |
39.5 |
71.5 |
52.8 |
49.4 |
108.2 |
|
12 |
Barshi rural (2012–2016) |
53.9 |
50.6 |
80.5 |
67.2 |
61.0 |
126.5 |
|
13 |
Mumbai (2012–2015) |
97.3 |
108.4 |
155.1 |
117.6 |
116.2 |
207.6 |
|
14 |
Pune (2012–2016) |
67.5 |
83.0 |
120.0 |
83.3 |
94.0 |
177.7 |
|
CENTRAL |
|||||||
|
15 |
Wardha district (2012–2016) |
70.4 |
64.5 |
109.7 |
78.7 |
69.9 |
148.9 |
|
16 |
Bhopal (2012–2015) |
83.3 |
101.0 |
180.0 |
90.4 |
106.9 |
223.3 |
|
17 |
Nagpur (2012–2016) |
89.0 |
91.1 |
158.6 |
93.1 |
89.8 |
188.2 |
|
NORTHEAST |
|||||||
|
18 |
Manipur state (2012–2016) |
47.0 |
62.8 |
91.0 |
57.8 |
71.1 |
129.6 |
|
19 |
Mizoram state (2012–2016) |
146.1 |
207.0 |
357.7 |
127.5 |
172.3 |
313.2 |
|
20 |
Sikkim state (2012–2016) |
69.9 |
88.7 |
131.5 |
75.3 |
97.0 |
175.2 |
|
21 |
Tripura state (2012–2016) |
67.0 |
80.9 |
145.9 |
52.0 |
58.3 |
127.3 |
|
22 |
West Arunachal (2012–2016) |
56.6 |
101.1 |
199.9 |
56.3 |
96.3 |
215.7 |
|
23 |
Meghalaya (2012–2016) |
92.6 |
176.8 |
386.0 |
55.7 |
96.5 |
201.1 |
|
24 |
Nagaland (2012–2016) |
74.5 |
124.5 |
223.8 |
56.3 |
88.2 |
193.6 |
|
25 |
Pasighat (2012–2016) |
90.7 |
120.4 |
207.6 |
88.1 |
116.2 |
260.3 |
|
26 |
Cachar district (2012–2016) |
99.2 |
129.0 |
233.4 |
87.0 |
104.8 |
234.2 |
|
27 |
Dibrugarh district (2012–2016) |
72.5 |
91.9 |
155.9 |
66.0 |
76.8 |
170.7 |
|
28 |
Kamrup urban (2012–2016) |
190.5 |
213.0 |
339.7 |
150.8 |
169.6 |
320.8 |
|
Males |
Females |
||||||
|---|---|---|---|---|---|---|---|
|
Cancer site (ICD 10) |
2015 |
2020 |
2025 |
Cancer site (ICD 10) |
2015 |
2020 |
2025 |
|
Lung (C33–34) |
63,087 |
71,788 |
81,219 |
Breast (C50) |
180,252 |
205,424 |
232,832 |
|
Mouth (C03–C06) |
50,779 |
57,380 |
64,519 |
Cervix (C53) |
65,978 |
75,209 |
85,241 |
|
Prostate (C61) |
36,419 |
41,532 |
47,068 |
Ovary (C56) |
38,607 |
43,886 |
49,644 |
|
Tongue (C01–C02) |
35,336 |
39,902 |
44,861 |
Corpus uteri (C54) |
23,175 |
26,514 |
30,121 |
|
Stomach (C16) |
28,815 |
32,713 |
36,938 |
Lung (C33–34) |
23,163 |
26,490 |
30,109 |
|
Others |
387,301 |
436,106 |
488,970 |
Others |
296,027 |
335,235 |
378,271 |
|
All sites |
601,737 |
679,421 |
763,575 |
All sites |
627,202 |
712,758 |
806,218 |
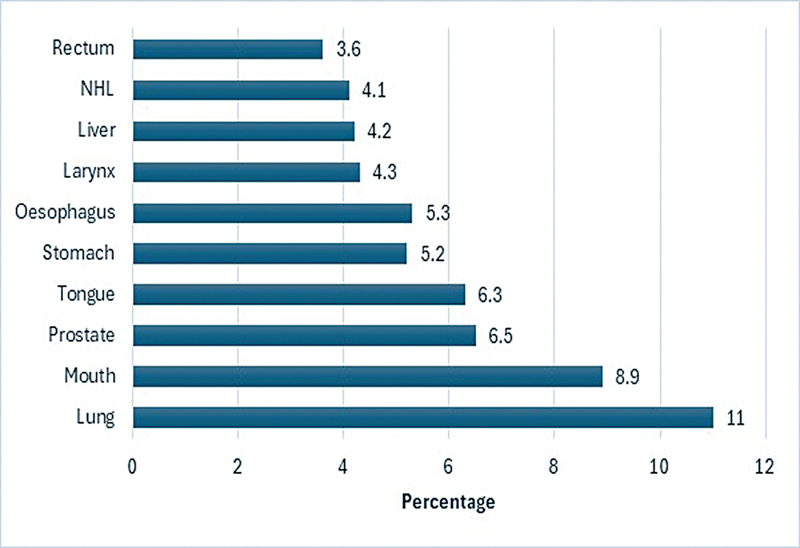
| Fig 1 : Estimated proportion of top 10 leading sites of cancer in India by sex, males 2024.
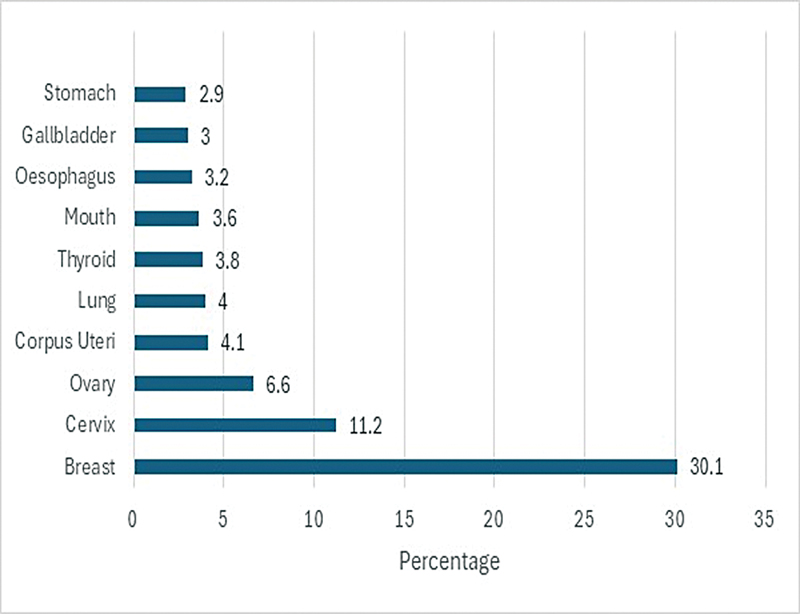
| Figure 2: Estimated proportion of top 10 leading sites of cancer in India by sex, females 2024.
According to age group (0–14, 15–39, 40–64, and 65 + ), [Table 4] presents the predicted top five sites of cancer (%) in India by gender for the year 2024. Lymphoid leukemia is the most common site in the childhood (0–14 years) group for both boys (29.06%) and girls (24.07%). Boys' brain nerve systems (NSs) come in second with 12.6% and girls' 14.17%, respectively. For males, in the 15- to 39-year-old age group, the most common sites are the mouth (12.6%), tongue (9.53%), brain NS (7.4%), myeloid leukemia (6.72%), and non-Hodgkin lymphoma (6.23%); for females, the most common sites are the breast (27.05%), thyroid (13.07), ovary (7.82%), cervix (6.69%), and myeloid leukemia (3.56%). The mouth (11.08%), tongue (7.52%), and lung (11.0%) were the most common sites among males in the 40 to 64 age group. The most common sites in females were the breast (32.3%), cervix (12.2%), and ovary (6.70%); there were high incidence of cases in this age range in both males (350,141) and females (439,960). In men over 65 years, the prostate (11.9%) was the second most common site after the lung (12.90%). Lung cancer was the most prevalent cancer in men over 40 years, while breast cancer was the most common in women.
|
Males |
Females |
||
|---|---|---|---|
|
Cancer site |
n (%) |
Cancer site |
n (%) |
|
0–14 years |
|||
|
Lymphoid leukemia (C91) |
6,365 (29.06) |
Lymphoid leukemia (C91) |
3,568 (24.07) |
|
Brain and NS (C70–C72) |
2,740 (12.6) |
Brain and NS (C70–C72) |
2,100 (14.17) |
|
NHL (C82–86, C96) |
1,720 (7.6) |
Bone (C40–C41) |
1,226 (8.27) |
|
Hodgkin's disease (C81) |
1,624 (7.6) |
Myeloid leukemia (C92–C94) |
1,270 (8.56) |
|
Myeloid leukemia (C92–C94) |
1,601 (7.31) |
NHL (C82–86, C96) |
953 (6.42) |
|
Other sites |
7,848 (36) |
Other sites |
5,705 (38.5) |
|
All sites |
21,898 (100) |
All sites |
14,822 (100) |
|
15–39 years |
|||
|
Mouth (C03–C06) |
10,122 (12.60) |
Breast (C50) |
27,562 (27.05) |
|
Tongue (C01–C02) |
7,652 (9.53) |
Thyroid (C73) |
13,324 (13.07) |
|
Brain and NS (C70–C72) |
5,923 (7.4) |
Ovary (C56) |
7,966 (7.82) |
|
Myeloid leukemia (C92–C94) |
5,400 (6.72) |
Cervix (C53) |
6,821 (6.69) |
|
NHL (C82–86, C96) |
5,012 (6.23) |
Myeloid leukemia (C92–C94) |
3,625 (3.56) |
|
Other sites |
46,216 (57.5) |
Other sites |
42,568 (41.8) |
|
All sites |
80,325 (100) |
All sites |
101,866 (100) |
|
40–64 years |
|||
|
Lung (C33–34) |
38,537 (11.0) |
Breast (C50) |
142,124 (32.3) |
|
Mouth (C03–C06) |
38,800 (11.08) |
Cervix (C53) |
53,687 (12.20) |
|
Tongue (C01–C02) |
26,354 (7.52) |
Ovary (C56) |
29,514 (6.70) |
|
Esophagus (C15) |
19,964 (5.7) |
Corpus uteri (C54) |
20,142 (4.6) |
|
Stomach (C16) |
19,231 (5.5) |
Lung (C33–34) |
15,841 (3.60) |
|
Other sites |
207,254 (59.19) |
Other sites |
178,652 (40.6) |
|
All sites |
350,141 (100) |
All sites |
439,960 (100) |
|
65+ years |
|||
|
Lung (C33–34) |
37,600 (12.90) |
Breast (C50) |
51,123 (22.7) |
|
Prostate (C61) |
34,562 (11.9) |
Cervix (C53) |
21,134 (9.4) |
|
Esophagus (C15) |
15,963 (5.5) |
Lung (C33–34) |
13,258 (5.9) |
|
Stomach (C16) |
15,623 (5.3) |
Ovary (C56) |
13,245 (5.87) |
|
Mouth (C03–C06) |
15,784 (5.40) |
Mouth (C03–C06) |
10,246 (4.54) |
|
Other sites |
172,231 (59.0) |
Other sites |
116,258 (51.6) |
|
All sites |
291,763 (100) |
All sites |
225,264 (100) |
References
- 1 Tyagi BB, Bhardwaj NK, Raina V. Time trends of cancer in a tertiary care centre 2013–2017. Int J Med Health Res 2019; 5 (11) 152-158
- 2 World Health Organization. World health statistics. 2019 : monitoring health for the SDGs, sustainable development goals. Published online 2019. Acces sed December 23, 2024 at: https://www.who.int/publications/i/item/9789241565707
- 3 Parkin DM. The evolution of the population-based cancer registry. Nat Rev Cancer 2006; 6 (08) 603-612
- 4 National Centre for Disease Informatics and Research. Consolidated Report of Population Based Cancer Registries, 2006–2008, 2009–2011, 2012–2014 Bengaluru, India, National Cancer Registry Programme. Accessed December 23, 2024 at: https://ncdirindia.org/Reports.aspx
- 5 National Centre for Disease Informatics and Research. Time trends in cancer incidence rates, 1982–2010, Bangalore: National Cancer Registry Programme (NCRP-ICMR),. 2013 . Accessed December 23, 2024 at: https://www.ncdirindia.org/All_Reports/TREND_REPORT_1982_2010/
- 6 Office of the Registrar General & Census Commissioner. India. Population in Five-Year Age Group by Residence and Sex. New Delhi (India); 2011 . Accessed May 20, 2023 at: https://censusindia.gov.in/nada/index.php/catalog/1541
- 7 Office of the Registrar General & Census Commissioner India. Census of India Website. Censusindia.gov.in. Published 2011 at: http://www.censusindia.gov.in/census.website
- 8 Babu GR, Lakshmi SB, Thiyagarajan JA. Epidemiological correlates of breast cancer in South India. Asian Pac J Cancer Prev 2013; 14 (09) 5077-5083
- 9 Thangjam S, Laishram RS, Debnath K. Breast carcinoma in young females below the age of 40 years: a histopathological perspective. South Asian J Cancer 2014; 3 (02) 97-100
- 10 Jonnada PK, Sushma C, Karyampudi M, Dharanikota A. Prevalence of molecular subtypes of breast cancer in India: a systematic review and meta-analysis. Indian J Surg Oncol 2021; 12 (Suppl. 01) 152-163
- 11 Ali I, Wani WA, Saleem K. Cancer scenario in India with future perspectives. Cancer Ther 2011; 8: 56-70
- 12 Srinath Reddy K, Shah B, Varghese C, Ramadoss A. Responding to the threat of chronic diseases in India. Lancet 2005; 366 (9498) 1744-1749
- 13 Mathur P, Sathishkumar K, Chaturvedi M. et al; ICMR-NCDIR-NCRP Investigator Group. Cancer Statistics, 2020: report from National Cancer Registry Programme, India. JCO Glob Oncol 2020; 6 (06) 1063-1075
- 14 Torre LA, Bray F, Siegel RL, Ferlay J, Lortet-Tieulent J, Jemal A. Global cancer statistics, 2012. CA Cancer J Clin 2015; 65 (02) 87-108
- 15 Time Trends in Cancer Incidence Rates 1982–2010. Accessed December 23, 2024 at: https://www.ncdirindia.org/All_Reports/TREND_REPORT_1982_2010/
- 16 Balasubramaniam SM, Rotti SB, Vivekanandam S. Risk factors of female breast carcinoma: a case control study at Puducherry. Indian J Cancer 2013; 50 (01) 65-70
- 17 Chopra B, Kaur V, Singh K, Verma M, Singh S, Singh A. Age shift: breast cancer is occurring in younger age groups - Is it true?. Clin Cancer Investig J 2014; 3 (06) 526-529
- 18 Sandhu DS, Sandhu S, Karwasra RK, Marwah S. Profile of breast cancer patients at a tertiary care hospital in north India. Indian J Cancer 2010; 47 (01) 16-22
- 19 Kakarala M, Rozek L, Cote M, Liyanage S, Brenner DE. Breast cancer histology and receptor status characterization in Asian Indian and Pakistani women in the U.S.–a SEER analysis. BMC Cancer 2010; 10: 191
- 20 Boyle P, Parkin D.M.. Statistical methods for registries. In Parkin D.M., C. S.Muir, S. L.Whelan, Y. T.Gao, J. Ferlay, J. Powell. (Eds.), Cancer Incidence in Five Continents, Volume VI. IARC Scientific Publications; No. 120. 126-158
- 21 Bray F, Znaor A, Cueva P. et al. Planning and Developing Population-Based Cancer Registration in Low- or Middle-Income Settings. Lyon, France:: International Agency for Research on Cancer;; 2014
- 22 Dhar M. A critical review of evolution of cancer registration in India. J Tumor Med Prev 2018; 2 (04) 555594
- 23 Sahoo S, Verma M, Parija P. An overview of cancer registration in India: present status and future challenges. Oncol J India 2018; 2 (04) 86
- 24 Behera P, Patro BK. Population Based Cancer Registry of India – the challenges and opportunities. Asian Pac J Cancer Prev 2018; 19 (10) 2885-2889
- 25 Murthy NS, Juneja A, Sehgal A, Prabhakar AK, Luthra UK. Cancer projection by the turn of century-Indian science. Indian J Cancer 1990; 27 (02) 74-82
- 26 Murthy NS, Chaudhry K, Rath GK. Burden of cancer and projections for 2016, Indian scenario: gaps in the availability of radiotherapy treatment facilities. Asian Pac J Cancer Prev 2008; 9 (04) 671-677
- 27 Swaminathan R, Shanta V, Ferlay J, Balasubramanian S, Bray F, Sankaranarayanan R. Trends in cancer incidence in Chennai city (1982–2006) and statewide predictions of future burden in Tamil Nadu (2007–16). Natl Med J India 2011; 24 (02) 72-77
- 28 Takiar R, Nadayil D, Nandakumar A. Projections of number of cancer cases in India (2010-2020) by cancer groups. Asian Pac J Cancer Prev 2010; 11 (04) 1045-1049
- 29 D'Souza NDR, Murthy NS, Aras RY. Projection of cancer incident cases for India -till 2026. Asian Pac J Cancer Prev 2013; 14 (07) 4379-4386
- 30 Kamangar F, Dores GM, Anderson WF. Patterns of cancer incidence, mortality, and prevalence across five continents: defining priorities to reduce cancer disparities in different geographic regions of the world. J Clin Oncol 2006; 24 (14) 2137-2150
- 31 Ferlay J, Colombet M, Soerjomataram I. et al. Estimating the global cancer incidence and mortality in 2018: GLOBOCAN sources and methods. Int J Cancer 2019; 144 (08) 1941-1953
- 32 Xia C, Dong X, Li H. et al. Cancer statistics in China and United States, 2022: profiles, trends, and determinants. Chin Med J (Engl) 2022; 135 (05) 584-590
- 33 Kakkar R, Aggarwal P. Civil registration and sample registration system: challenges and initiatives. SRHU Med J 2017; 1 (01) 47-49
- 34 Porter PL. Global trends in breast cancer incidence and mortality. Salud Publica Mex 2009; 51 (Suppl. 02) s141-s146
- 35 Kishore S, Kiran K. Cancer scenario in India and its comparison with rest of the world and future perspectives. Indian J Community Health 2019; 31 (01) 1-3
Address for correspondence
Publication History
Article published online:
04 February 2025
© 2025. The Author(s). This is an open access article published by Thieme under the terms of the Creative Commons Attribution License, permitting unrestricted use, distribution, and reproduction so long as the original work is properly cited. (https://creativecommons.org/licenses/by/4.0/)
Thieme Medical and Scientific Publishers Pvt. Ltd.
A-12, 2nd Floor, Sector 2, Noida-201301 UP, India
- Ecological Analysis to Study Association between Prevalence of Smokeless Tobacco Type and Head-and-Neck CancerDevyani Dilip Gholap, Indian Journal of Medical and Paediatric Oncology, 2018
- Incidence and Pattern of Childhood Cancers in India: Findings from Population-based Cancer RegistriesMD Abu Bashar, Indian Journal of Medical and Paediatric Oncology, 2017
- Tobacco-related cancers in India: A review of incidence reported from population-based cancer registriesSmita Asthana, Indian Journal of Medical and Paediatric Oncology, 2016
- Trends in gallbladder cancer incidence in the high- and low-risk regions of IndiaPrachi Ravindra Phadke, Indian Journal of Medical and Paediatric Oncology, 2019
- Incidence and Trends of Breast and Cervical Cancers: A Joinpoint Regression AnalysisSatyanarayana Labani, Indian Journal of Medical and Paediatric Oncology, 2020
- Continuous Increasing Prevalence of Chronic Lymphocytic Leukemia (CLL) with an Estimated Future Rise—a Nationwide Population-Based Study from Sweden<svg viewBox="0 0 24 24" fill="none" xmlns="http://www.w3.org/2000/svg">
- Population-Level Projections for Multiple Myeloma Patients By Line of Therapy in the USA<svg viewBox="0 0 24 24" fill="none" xmlns="http://www.w3.org/2000/svg">
- Acute Leukemia in Hispanic Americans: Incidence and Incidence Rate Differences by Nativity.<svg viewBox="0 0 24 24" fill="none" xmlns="http://www.w3.org/2000/svg">
- Epidemiology of Myelofibrosis (MF), Polycythemia Vera (PV) and Essential Thrombocythemia (ET) in the European Union (EU)<svg viewBox="0 0 24 24" fill="none" xmlns="http://www.w3.org/2000/svg">
- Hodgkin's Lymphoma in the Portuguese Population – Epidemiological and Pathological Characterization.<svg viewBox="0 0 24 24" fill="none" xmlns="http://www.w3.org/2000/svg">
| Fig 1 :
| Figure 2:
| Figure 3:
| Figure 4:
| Fig 1 : Estimated proportion of top 10 leading sites of cancer in India by sex, males 2024.
| Figure 2: Estimated proportion of top 10 leading sites of cancer in India by sex, females 2024.
References
- 1 Tyagi BB, Bhardwaj NK, Raina V. Time trends of cancer in a tertiary care centre 2013–2017. Int J Med Health Res 2019; 5 (11) 152-158
- 2 World Health Organization. World health statistics. 2019 : monitoring health for the SDGs, sustainable development goals. Published online 2019. Acces sed December 23, 2024 at: https://www.who.int/publications/i/item/9789241565707
- 3 Parkin DM. The evolution of the population-based cancer registry. Nat Rev Cancer 2006; 6 (08) 603-612
- 4 National Centre for Disease Informatics and Research. Consolidated Report of Population Based Cancer Registries, 2006–2008, 2009–2011, 2012–2014 Bengaluru, India, National Cancer Registry Programme. Accessed December 23, 2024 at: https://ncdirindia.org/Reports.aspx
- 5 National Centre for Disease Informatics and Research. Time trends in cancer incidence rates, 1982–2010, Bangalore: National Cancer Registry Programme (NCRP-ICMR),. 2013 . Accessed December 23, 2024 at: https://www.ncdirindia.org/All_Reports/TREND_REPORT_1982_2010/
- 6 Office of the Registrar General & Census Commissioner. India. Population in Five-Year Age Group by Residence and Sex. New Delhi (India); 2011 . Accessed May 20, 2023 at: https://censusindia.gov.in/nada/index.php/catalog/1541
- 7 Office of the Registrar General & Census Commissioner India. Census of India Website. Censusindia.gov.in. Published 2011 at: http://www.censusindia.gov.in/census.website
- 8 Babu GR, Lakshmi SB, Thiyagarajan JA. Epidemiological correlates of breast cancer in South India. Asian Pac J Cancer Prev 2013; 14 (09) 5077-5083
- 9 Thangjam S, Laishram RS, Debnath K. Breast carcinoma in young females below the age of 40 years: a histopathological perspective. South Asian J Cancer 2014; 3 (02) 97-100
- 10 Jonnada PK, Sushma C, Karyampudi M, Dharanikota A. Prevalence of molecular subtypes of breast cancer in India: a systematic review and meta-analysis. Indian J Surg Oncol 2021; 12 (Suppl. 01) 152-163
- 11 Ali I, Wani WA, Saleem K. Cancer scenario in India with future perspectives. Cancer Ther 2011; 8: 56-70
- 12 Srinath Reddy K, Shah B, Varghese C, Ramadoss A. Responding to the threat of chronic diseases in India. Lancet 2005; 366 (9498) 1744-1749
- 13 Mathur P, Sathishkumar K, Chaturvedi M. et al; ICMR-NCDIR-NCRP Investigator Group. Cancer Statistics, 2020: report from National Cancer Registry Programme, India. JCO Glob Oncol 2020; 6 (06) 1063-1075
- 14 Torre LA, Bray F, Siegel RL, Ferlay J, Lortet-Tieulent J, Jemal A. Global cancer statistics, 2012. CA Cancer J Clin 2015; 65 (02) 87-108
- 15 Time Trends in Cancer Incidence Rates 1982–2010. Accessed December 23, 2024 at: https://www.ncdirindia.org/All_Reports/TREND_REPORT_1982_2010/
- 16 Balasubramaniam SM, Rotti SB, Vivekanandam S. Risk factors of female breast carcinoma: a case control study at Puducherry. Indian J Cancer 2013; 50 (01) 65-70
- 17 Chopra B, Kaur V, Singh K, Verma M, Singh S, Singh A. Age shift: breast cancer is occurring in younger age groups - Is it true?. Clin Cancer Investig J 2014; 3 (06) 526-529
- 18 Sandhu DS, Sandhu S, Karwasra RK, Marwah S. Profile of breast cancer patients at a tertiary care hospital in north India. Indian J Cancer 2010; 47 (01) 16-22
- 19 Kakarala M, Rozek L, Cote M, Liyanage S, Brenner DE. Breast cancer histology and receptor status characterization in Asian Indian and Pakistani women in the U.S.–a SEER analysis. BMC Cancer 2010; 10: 191
- 20 Boyle P, Parkin D.M.. Statistical methods for registries. In Parkin D.M., C. S.Muir, S. L.Whelan, Y. T.Gao, J. Ferlay, J. Powell. (Eds.), Cancer Incidence in Five Continents, Volume VI. IARC Scientific Publications; No. 120. 126-158
- 21 Bray F, Znaor A, Cueva P. et al. Planning and Developing Population-Based Cancer Registration in Low- or Middle-Income Settings. Lyon, France:: International Agency for Research on Cancer;; 2014
- 22 Dhar M. A critical review of evolution of cancer registration in India. J Tumor Med Prev 2018; 2 (04) 555594
- 23 Sahoo S, Verma M, Parija P. An overview of cancer registration in India: present status and future challenges. Oncol J India 2018; 2 (04) 86
- 24 Behera P, Patro BK. Population Based Cancer Registry of India – the challenges and opportunities. Asian Pac J Cancer Prev 2018; 19 (10) 2885-2889
- 25 Murthy NS, Juneja A, Sehgal A, Prabhakar AK, Luthra UK. Cancer projection by the turn of century-Indian science. Indian J Cancer 1990; 27 (02) 74-82
- 26 Murthy NS, Chaudhry K, Rath GK. Burden of cancer and projections for 2016, Indian scenario: gaps in the availability of radiotherapy treatment facilities. Asian Pac J Cancer Prev 2008; 9 (04) 671-677
- 27 Swaminathan R, Shanta V, Ferlay J, Balasubramanian S, Bray F, Sankaranarayanan R. Trends in cancer incidence in Chennai city (1982–2006) and statewide predictions of future burden in Tamil Nadu (2007–16). Natl Med J India 2011; 24 (02) 72-77
- 28 Takiar R, Nadayil D, Nandakumar A. Projections of number of cancer cases in India (2010-2020) by cancer groups. Asian Pac J Cancer Prev 2010; 11 (04) 1045-1049
- 29 D'Souza NDR, Murthy NS, Aras RY. Projection of cancer incident cases for India -till 2026. Asian Pac J Cancer Prev 2013; 14 (07) 4379-4386
- 30 Kamangar F, Dores GM, Anderson WF. Patterns of cancer incidence, mortality, and prevalence across five continents: defining priorities to reduce cancer disparities in different geographic regions of the world. J Clin Oncol 2006; 24 (14) 2137-2150
- 31 Ferlay J, Colombet M, Soerjomataram I. et al. Estimating the global cancer incidence and mortality in 2018: GLOBOCAN sources and methods. Int J Cancer 2019; 144 (08) 1941-1953
- 32 Xia C, Dong X, Li H. et al. Cancer statistics in China and United States, 2022: profiles, trends, and determinants. Chin Med J (Engl) 2022; 135 (05) 584-590
- 33 Kakkar R, Aggarwal P. Civil registration and sample registration system: challenges and initiatives. SRHU Med J 2017; 1 (01) 47-49
- 34 Porter PL. Global trends in breast cancer incidence and mortality. Salud Publica Mex 2009; 51 (Suppl. 02) s141-s146
- 35 Kishore S, Kiran K. Cancer scenario in India and its comparison with rest of the world and future perspectives. Indian J Community Health 2019; 31 (01) 1-3