 PDF
PDF  Views
Views  Share
Share


Evaluation of Metabolic Syndrome and Related Factors in Children Affected by Acute Lymphoblastic Leukemia
CC BY-NC-ND 4.0 · Indian J Med Paediatr Oncol 2017; 38(02): 97-102
DOI: DOI: 10.4103/ijmpo.ijmpo_69_16
Abstract
Introduction: Obesity is among the medical problems in survivors of childhood acute lymphoblastic leukemia (ALL). These patients are at risk of metabolic syndrome (MS). The present study aimed to follow the patients with ALL regarding the incidence of MS. Patients and Methods: This study was conducted on all patients who referred to the oncology clinic from July 2012 to July 2013. The exclusion criteria of the study were ALL relapse, secondary malignancy, hypothyroidism, Down syndrome, and below 2 years of age. ALL had to be diagnosed at least 12 months before enrollment into this study. MS was assessed by serum triglyceride, cholesterol, fasting blood sugar, leptin, and insulin levels. Besides, body mass index (BMI) and blood pressure (BP) were measured at diagnosis and at the last visit. Results: This study was conducted on 53 patients (male = 35, female = 18). At the end of the study, 13 patients (24.53%) were overweight compared to 3 patients at diagnosis (P = 0.04). The mean blood leptin level was higher in overweight patients compared to the others (P = 0.001). MS was detected in 21 patients (39.6%), including 12 males and 9 females. In addition, the BMI Z- score significantly increased over the study period (P = 0.001). Conclusions: Being overweight is a complication of ALL treatment, which is associated with elevated blood leptin level and BMI Z- score. Therefore, MS criteria, such as BP, weight, and serum triglyceride level, should be taken into account in each visit.
Publication History
Article published online:
06 July 2021
© 2017. Indian Society of Medical and Paediatric Oncology. This is an open access article published by Thieme under the terms of the Creative Commons Attribution-NonDerivative-NonCommercial-License, permitting copying and reproduction so long as the original work is given appropriate credit. Contents may not be used for commercial purposes, or adapted, remixed, transformed or built upon. (https://creativecommons.org/licenses/by-nc-nd/4.0/.)
Thieme Medical and Scientific Publishers Pvt. Ltd.
A-12, 2nd Floor, Sector 2, Noida-201301 UP, India
Abstract
Introduction:
Obesity is among the medical problems in survivors of childhood acute lymphoblastic leukemia (ALL). These patients are at risk of metabolic syndrome (MS). The present study aimed to follow the patients with ALL regarding the incidence of MS.
Patients and Methods:
This study was conducted on all patients who referred to the oncology clinic from July 2012 to July 2013. The exclusion criteria of the study were ALL relapse, secondary malignancy, hypothyroidism, Down syndrome, and below 2 years of age. ALL had to be diagnosed at least 12 months before enrollment into this study. MS was assessed by serum triglyceride, cholesterol, fasting blood sugar, leptin, and insulin levels. Besides, body mass index (BMI) and blood pressure (BP) were measured at diagnosis and at the last visit.
Results:
This study was conducted on 53 patients (male = 35, female = 18). At the end of the study, 13 patients (24.53%) were overweight compared to 3 patients at diagnosis (P = 0.04). The mean blood leptin level was higher in overweight patients compared to the others (P = 0.001). MS was detected in 21 patients (39.6%), including 12 males and 9 females. In addition, the BMI Z-score significantly increased over the study period (P = 0.001).
Conclusions:
Being overweight is a complication of ALL treatment, which is associated with elevated blood leptin level and BMI Z-score. Therefore, MS criteria, such as BP, weight, and serum triglyceride level, should be taken into account in each visit.
Introduction
Acute lymphoblastic leukemia (ALL) is the most common malignancy in childhood[1] with an annual incidence rate of approximately 3.9/100,000 children.[2] The overall survival rate in 25 years from the initial diagnosis is 86.8%.[3] A study on acute leukemia survivors with follow-up time of 0–25 years showed that one or more adverse events, with defective physical growth being the most common, might occur in 74.1% of the patients.[4] Obesity following treatment for childhood ALL was reported in 11%–57% of the survivors.[1,5]
Another study indicated that ALL survivors were at high risk of obesity with the prevalence rate of 11%–40%.[6] Metabolic syndrome (MS) is a cluster of conditions, including increased blood pressure (BP), high blood sugar level, excess body fat around the waist, and abnormal cholesterol levels, which might occur together or alone, increasing the risk of heart disease, stroke, and diabetes.[1,5] The prevalence of MS was 16% among adolescents and young adult Finnish survivors of pediatric cancer (56% of whom had ALL) compared to 0% among the controls.[1]
In general, many factors may be involved in the pathogenesis of obesity in ALL survivors. Some studies have revealed that glucocorticoid administration for 5 weeks resulted in a significant increase in body mass index (BMI).[7] Leptin is a protein which is synthesized in lipoid tissue and changes in leptin levels have been thought to be effective in controlling obesity.[8]
Hence, measurement of leptin may be helpful in controlling obesity in ALL survivors.
Yet, cranial radiotherapy (CRT) has been the most frequently cited treatment-related risk factor for obesity and hypertension among the ALL patients.[8] Therefore, parameters of MS should be included as routine assessments in outpatient clinics taking care of childhood leukemia survivors.[7] The present study aims to assess the prevalence of MS in the pediatric ALL survivors.
Patients and Methods
The present study was conducted on the pediatric patients visited in the oncology clinic affiliated to Shiraz University of Medical Sciences from July 2012 to July 2013. ALL diagnosis was confirmed by bone marrow aspiration and biopsy, immunohistochemistry, and flow cytometry studies. The patients with secondary malignancy, Down syndrome, hypothyroidism, history of familial hyperlipidemia, and relapse of ALL, and those below 2 years of age were excluded from the study. Among the 105 eligible patients, 90 were invited to participate in the study, but only 53 (50.47%) could be completely assessed. This study was approved by the Ethics Committee of Shiraz University of Medical Sciences. Besides, written informed consent for taking part in the study was obtained from all the participants. All the patients received prednisone, vincristine, and L-asparaginase as induction chemotherapy. Doxorubicin was also added for high-risk patients. Most patients received dexamethasone, daunorubicin, doxorubicin, cyclophosphamide, cytarabine, 6-thioguanine, methotrexate, and 6-mercaptopurine as consolidation and maintenance therapy. The drug doses were adjusted based on body surface area. All the patients received central nervous system chemoprophylaxis with age-adjusted dose of intrathecal methotrexate. Besides, CRT was administered to most of the high-risk patients. It should be mentioned that there were no protocol-required treatment modifications for obesity, and individual reports from the obese patients in the study cohort were reviewed to assess the off-protocol dose modifications as a result of obesity.
At first, 10 ml fasting blood samples were collected. Then, the sera were separated and stored at-20°C to evaluate leptin, insulin, fasting blood sugar (FBS), total cholesterol, low-density lipoprotein (LDL), and high-density lipoprotein (HDL) levels. Leptin level (Pg/ml) was measured using enzyme-linked immunosorbent assay (ELISA) method (leptin ELISA kit, Orgenium, Finland). Insulin level was also measured using the same method (Monobind, USA).
Abnormalities in fasting triglycerides and HDL cholesterol blood levels were adjusted for age and sex (>95th percentile for triglycerides; <5 xss=removed>th percentile for HDL cholesterol). FBS levels >100 mg/dl were also considered.
The patients’ BP was measured on three consecutive days, and the mean of the three measurements was considered as BP at the time of admission. The patients’ BP was also recorded in each follow-up visit in the outpatient clinic. BP percentiles were calculated by age, sex, and height percentiles according to the book “2000 Center for Disease Control (CDC) growth charts for the United States: Methods and development.”[9]
The patients whose systolic or diastolic BP was <90>99 percentile were considered as normotensive, prehypertensive, Stage I hypertensive, and Stage II hypertensive, respectively.
To date, there is no consensus on a specific definition for MS in children and adolescents. The criteria used in this study to diagnose MS were modified from those of the National Cholesterol Education Program's Adult Treatment Panel (NCEP-ATP),[10] International Diabetes Federation (IDF), IDF – derived (IDF 2005), and NCEP-ATP III.[11]
BMI percentile chart was extracted from the book “2000 CDC growth charts for the United States: Methods and development.”[10]
Accordingly, the patients with BMI
Metabolic syndrome criteria
In the present study, MS was defined by 2 criteria, the first of which being obesity on the basis of a threshold BMI Z-score of 2.0 or above, adjusted for age and sex, and elevated systolic or diastolic BP exceeding the 95th percentile for age and sex.
Regarding the second criterion, the patients were classified as having MS if they met three or more of the following criteria based on age and sex: 1-BMI above the 97th percentile (Z-score: 2.0 or above), 2-triglyceride level above the 95th percentile, 3-HDL cholesterol level below the 5th percentile, 4-systolic or diastolic BP above the 95th percentile, and 5-FBS level >100 mg/dl. Then, the BMI Z-scores were compared between the time of diagnosis and the end of follow-up. This definition is similar to Weiss criteria in definition of MS.[12]
Statistical analysis
All the statistical analyses were performed using the SPSS statistical software (version 17, Chicago, Illinois, USA). Chi-square and Fisher's exact tests were used for the comparison of categorical variables between the two groups. Besides, Student's t-test was used to compare the quantitative variables between the two groups. In addition, paired t-test was used to compare the patients’ BMI Z-score at the time of diagnosis and at the last follow-up. P < 0>
Results
The participants’ characteristics have been presented in Table 1. Accordingly, the overall prevalence of MS by the first criteria was 15.09% (95% confidence interval, n = 8). However, the prevalence of MS was much higher (39.6%) based on the second criteria. Regarding Weiss criteria (first criteria), the prevalence of 1 MS component was 35.84% (n = 19), while the prevalence of 2 MS components was 30.18% (n = 16). Besides, 3 MS components were seen in 11.32% of patients (n = 6), and the prevalence of 4 MS components was 1.88% (n = 1).
Table 1
Characteristics of the acute lymphoblastic leukemia survivors

|
Our study results revealed a significant difference between BMI Z-scores at the time of diagnosis and at the last follow-up (P = 0.001) [Figure 1].
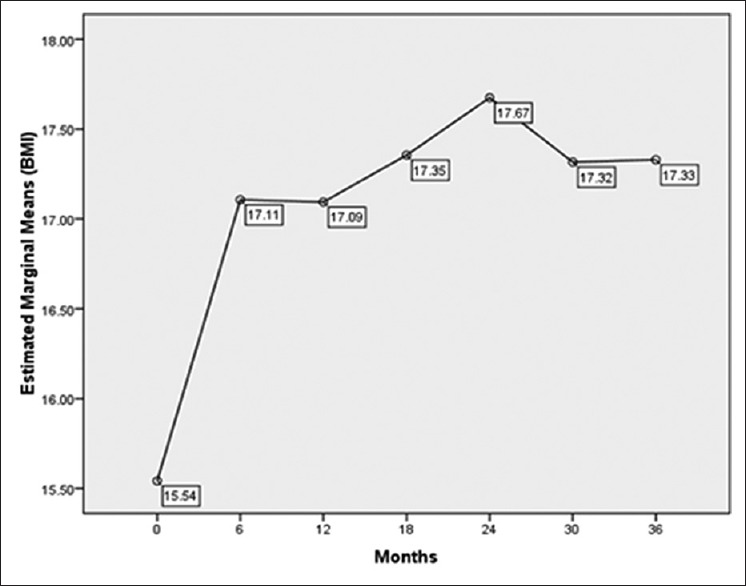
| Figure 1Mean values of body mass index in childhood acute lymphoblastic leukemia survivors during 36 months follow-up
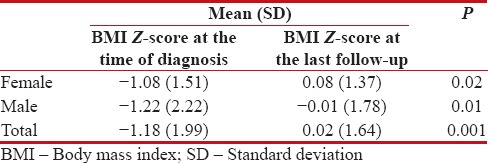
However, no significant difference was found between the male and female patients’ BMI Z-scores at the time of diagnosis and at the last follow-up (0.81 vs. 0.84) [Table 2]. Nonetheless, a significant difference was observed between the BMI Z-scores at the time of diagnosis and at the last follow-up in both female (P = 0.02) and male patients (P = 0.01).
Table 2
Comparison of body mass index Z-scores in male and female acute lymphoblastic leukemia survivors
|
The study findings demonstrated no statistically significant difference between the patients with MS and those without MS concerning serum leptin levels (P = 0.13). Similar results were also obtained with respect to serum insulin levels (P = 0.60).
Moreover, MS was detected in 4 out of the 10 patients who had received CRT. Among these patients, no significant differences were found between the individuals with MS and those without MS regarding the BMI Z-scores at the time of ALL diagnosis (P = 0.38).
According to the results, alkaline phosphatase blood levels at the time of ALL diagnosis were higher in the patients with MS compared to those without MS (422 ± 234 vs. 317 ± 123, P = 0.05).
Discussion
In the current study, 35 patients were male, representing a greater incidence of childhood ALL in males. Obesity and being overweight were evident in 5.66% of the ALL patients at the time of diagnosis, and BMI significantly increased during the treatment. In the last follow-up, 24.53% of the patients were overweight or obese, and the difference was statistically significant. The prevalence of obesity varies in different researches.[13]
Zhang et al. conducted a study on 83 patients and reported the prevalence rates of overweight (BMI ≥85% percentile) to be approximately 21% and 40% at the time of diagnosis and 5 years after treatment, respectively.[14] Besides, Aldhafiri et al. reported the prevalence of overweight and obesity at diagnosis to be 35%.[15]
In addition, Jansen et al. reported obesity in 52% of the ALL patients and 7.41% of the patients with brain tumor 12 months after completion of therapy.[16]
Moreover, another study demonstrated the incidence rate of obesity to be 15% and 40% at the time of diagnosis and at the end of treatment, respectively.[17]
Our study findings revealed a significant increase in BMI 6 months after starting the treatment, which is in line with the findings obtained by Zhang et al.[14] In the present study, BMI followed an increasing trend 2 years after starting the treatment. Afterward, a slight decrease was observed, and then, BMI increased again with a slower slope. To date, no accurate statistics are available regarding the prevalence of obesity in normal Iranian children to compare the prevalence of obesity. If we consider the prevalence rate of obesity to be 20% in healthy children,[13,18] the rate of obesity at the end of the treatment in this study was not significantly different from the normal pediatric population. This is in agreement with the results of a study that showed no significant difference between the normal population and ALL patients 2 years after treatment.[6]
High-dose corticosteroid therapy which is started at the beginning of treatment may be one of the reasons for the sudden increase in weight during the first 6 months.
These children's parents’ high sensitivity toward their diet, excessive care, and limited physical activity may also be important in the patients’ weight gain during the early months of diagnosis.
Nevertheless, the results revealed weight loss in the patients within 30 months after the treatment. Although this weight loss was not statistically significant, it is clinically evaluable and needs investigation. After an average follow-up of approximately 42 months, a significant increase in BMI was noticed again.
The current study results indicated a significant increase in serum leptin levels in the patients with BMI ≥85% compared to those with BMI <85>
In this study, the mean leptin level was 554 ± 653 Pg/ml. However, this study did not include a control group. Some researchers have reported the normal leptin level to be 1000–16,000 pg/ml in men and women with <15 href="https://www.ncbi.nlm.nih.gov/pmc/articles/PMC5582576/#ref19" rid="ref19" class=" bibr popnode tag_hotlink tag_tooltip" id="__tag_635950214" role="button" aria-expanded="false" aria-haspopup="true" xss=removed>19,20]
It is evident that the present study patients’ leptin levels were lower than normal. Theoretically, this might be due to impaired leptin production by adipose tissue.
In the study by Wex et al., the ALL patients’ leptin level was low at the time of diagnosis but increased above that of the normal controls 33 days after the diagnosis.[21]
Several researchers have also reported that the ALL patients’ leptin levels were higher in comparison to the normal people after treatment.[2]
It seems that leptin levels were various in different phases of ALL therapy. Thus, further studies are required for better assessment of this variation and even its association with response to treatment.
The current study results indicated a significant increase in the obese patients’ serum leptin levels compared to the nonobese ones. Besides, females had higher serum leptin levels in comparison to males. This finding has been confirmed in some previous studies.[16,22,23]
Unlike, the majority of the previous studies although the patients who had undergone CRT were slightly more obese and had higher leptin levels (718.7 Pg/ml vs. 503.48 Pg/ml), this difference was not statistically significant. This was similar to the findings of Withycombe et al.[5] and Razzouk et al.,[24] but in contrast to those of some other studies.[22]
Contrary to some previous studies,[4,25] the current study findings demonstrated no significant differences between the patients who received CRT and those who did not concerning serum total cholesterol, LDL, and insulin levels and BMI. However, the two groups were significantly different with respect to triglyceride levels.
Considering the rate of obesity, certain attention and screening are needed in ALL patients in the first 6 months of treatment because BMI follows a sharp increasing trend in this time interval. Overall, many factors may be involved in increase of BMI in the children with ALL. These factors include high-dose steroids,[13] sex,[17] CRT,[5,22] physical activity,[26] and resistance to leptin.[6] Thus, these children's parents should pay more attention to their children's nutrition. This is of considerable importance in ALL patients since increased survival enhances the incidence of MS in these patients. MS, in turn, increases the risk of cardiovascular diseases; thus, efforts should be made to control this syndrome.
Among the 53 eligible patients in this study, 21 (39.6%) including 12 males and 9 females developed MS.
In the study by Aldhafiri et al., the prevalence of MS was 7.1% in the patients above 9-year-old and 5.4% by applying the IDF definition and NCEP III-ATP guidelines, respectively.[15] However, MS by the NCEP III definition was present in 19% of the overweight and obese survivors and 7.1% of the sample had at least two of the components of MS.[25]
In our study, the mean age of the patients with and without MS was 9.77 and 9.24 years, respectively, but the difference was not statistically significant. In addition, the mean follow-up period of the patients with and without MS was 40.3 and 42.3 months, respectively. However, the difference was not statistically significant. Yet, comparison of these figures indicates that the ALL patients’ chance of developing MS might increase during treatment.
Esbenshade et al. in a study on pediatric ALL patients revealed that obesity and insulin resistance worsened during maintenance therapy.[27]
A research in Iran revealed that the frequency of obesity was 25% and nearly 3/4 of obese patients had MS, which is roughly similar to our study.[28]
Our results indicated no significant difference between the patients with MS and those without MS regard to the parents’ education levels.
Nonetheless, some studies have established a strong relationship between parental years of education and childhood obesity.[13,29]
Conclusions
Based on our study findings, obesity as a highly morbid disease should be considered in ALL survivors. In obese patients, leptin resistance of hypothalamus should be considered as well. Therefore, paying attention to the risk factors of MS is necessary and reasonable in the treatment process and follow-up of the ALL patients, even years after treatment.[1]
Moreover, early diagnosis and monitoring of the patients with ALL should be considered, and appropriate treatment measures should be taken to prevent complications.
Financial support and sponsorship
Nil.
Conflicts of interest
There are no conflicts of interest.
Acknowledgment
Our sincere thanks go to Ms. A. Keivanshekouh at the Research Improvement Center of Shiraz University of Medical Sciences for improving the use of English in the manuscript.
References
- Ness KK, Armenian SH, Kadan-Lottick N, Gurney JG. Adverse effects of treatment in childhood acute lymphoblastic leukemia: General overview and implications for long-term cardiac health. Expert Rev Hematol 2011;4:185-97.
- Iughetti L, Bruzzi P, Predieri B, Paolucci P. Obesity in patients with acute lymphoblastic leukemia in childhood. Ital J Pediatr 2012;38:4.
- Robison LL. Late effects of acute lymphoblastic leukemia therapy in patients diagnosed at 0-20 years of age. Hematology Am Soc Hematol Educ Program 2011;2011:238-42.
- TB, Mosher RB, Reaman GH. Late effects in long-term survivors after treatment for childhood acute leukemia. Clin Pediatr (Phila) 2009;48:601-8.
- Withycombe JS, Post-White JE, Meza JL, Hawks RG, Smith LM, Sacks N, et al. Weight patterns in children with higher risk ALL: A report from the Children's Oncology Group (COG) for CCG 1961. Pediatr Blood Cancer 2009;53:1249-54.
- Pakakasama S, Veerakul G, Sosothikul D, Chainansamit SO, Laosombat V, Thanarattanakorn P, et al. Late effects in survivors of childhood acute lymphoblastic leukemia: A study from Thai Pediatric Oncology Group. Int J Hematol 2010;91:850-4.
- Wallace AM, Tucker P, Williams DM, Hughes IA, Ahmed SF. Short-term effects of prednisolone and dexamethasone on circulating concentrations of leptin and sex hormone-binding globulin in children being treated for acute lymphoblastic leukaemia. Clin Endocrinol (Oxf) 2003;58:770-6.
- Skoczen S, Tomasik PJ, Bik-Multanowski M, Surmiak M, Balwierz W, Pietrzyk JJ, et al. Plasma levels of leptin and soluble leptin receptor and polymorphisms of leptin gene -18G>A and leptin receptor genes K109R and Q223R, in survivors of childhood acute lymphoblastic leukemia. J Exp Clin Cancer Res 2011;30:64.
- Kuczmarski RJ, Ogden CL, Guo SS, Grummer-Strawn LM, Flegal KM, Mei Z, et al. 2000 CDC Growth Charts for the United States: Methods and development. Vital Health Stat 11 2002;246:1-190.
- ;Available from: http://www.cdc.gov/growthcharts/clinical_charts.htm. [Last accessed 2016 Mar 28].
- Expert Panel on Detection, Evaluation, and Treatment of High Blood Cholesterol in Adults. Executive Summary of the Third Report of the National Cholesterol Education Program (NCEP) Expert Panel on Detection, Evaluation, and Treatment of High Blood Cholesterol in Adults (Adult Treatment Panel III). JAMA 2001;285:2486-97.
- Weiss R, Dziura J, Burgert TS, Tamborlane WV, Taksali SE, Yeckel CW, et al. Obesity and the metabolic syndrome in children and adolescents. N Engl J Med 2004;350:2362-74.
- Lamerz A, Kuepper-Nybelen J, Wehle C, Bruning N, Trost-Brinkhues G, Brenner H, et al. Social class, parental education, and obesity prevalence in a study of six-year-old children in Germany. Int J Obes (Lond) 2005;29:373-80.
- Zhang LD, Li YH, Ke ZY, Huang LB, Luo XQ. Obesity as the initial manifestation of central nervous system relapse of acute lymphoblastic leukemia: Case report and literature review. J Cancer Res Ther 2012;8:151-3.
- Aldhafiri F, Al-Nasser A, Al-Sugair A, Al-Mutairi H, Young D, Reilly JJ. Obesity and metabolic syndrome in adolescent survivors of standard risk childhood acute lymphoblastic leukemia in Saudi Arabia. Pediatr Blood Cancer 2012;59:133-7.
- Jansen H, Postma A, Stolk RP, Kamps WA. Acute lymphoblastic leukemia and obesity: Increased energy intake or decreased physical activity? Support Care Cancer 2009;17:103-6.
- Szymon S, Bik-Multanowski M, Balwierz W, Pietrzyk JJ, Surmiak M, Strojny W, et al. Homozygosity for the rs9939609T allele of the FTO gene may have protective effect on becoming overweight in survivors of childhood acute lymphoblastic leukaemia. J Genet 2011;90:365-8.
- Collins L, Zarzabal LA, Nayiager T, Pollock BH, Barr RD. Growth in children with acute lymphoblastic leukemia during treatment. J Pediatr Hematol Oncol 2010;32:e304-7.
- Gofman I, Ducore J. Risk factors for the development of obesity in children surviving ALL and NHL. J Pediatr Hematol Oncol 2009;31:101-7.
- Butturini AM, Dorey FJ, Lange BJ, Henry DW, Gaynon PS, Fu C, et al. Obesity and outcome in pediatric acute lymphoblastic leukemia. J Clin Oncol 2007;25:2063-9.
- Wex H, Ponelis E, Wex T, Dressendörfer R, Mittler U, Vorwerk P. Plasma leptin and leptin receptor expression in childhood acute lymphoblastic leukemia. Int J Hematol 2002;76:446-52.
- Ethier MC, Alexander S, Abla O, Green G, Lam R, Sung L. Association between obesity at diagnosis and weight change during induction and survival in pediatric acute lymphoblastic leukemia. Leuk Lymphoma 2012;53:1677-81.
- Asner S, Ammann RA, Ozsahin H, Beck-Popovic M, von der Weid NX. Obesity in long-term survivors of childhood acute lymphoblastic leukemia. Pediatr Blood Cancer 2008;51:118-22.
- Razzouk BI, Rose SR, Hongeng S, Wallace D, Smeltzer MP, Zacher M, et al. Obesity in survivors of childhood acute lymphoblastic leukemia and lymphoma. J Clin Oncol 2007;25:1183-9.
- Tonorezos ES, Vega GL, Sklar CA, Chou JF, Moskowitz CS, Mo Q, et al. Adipokines, body fatness, and insulin resistance among survivors of childhood leukemia. Pediatr Blood Cancer 2012;58:31-6.
- Garmey EG, Liu Q, Sklar CA, Meacham LR, Mertens AC, Stovall MA, et al. Longitudinal changes in obesity and body mass index among adult survivors of childhood acute lymphoblastic leukemia: A report from the Childhood Cancer Survivor Study. J Clin Oncol 2008;26:4639-45.
- Esbenshade AJ, Simmons JH, Koyama T, Lindell RB, Friedman DL. Obesity and insulin resistance in pediatric acute lymphoblastic leukemia worsens during maintenance therapy. Pediatr Blood Cancer 2013;60:1287-91.
- Reisi N, Azhir A, Hashemipour M, Raeissi P, Amini A, Moafi A. The metabolic syndrome in survivors of childhood acute lymphoblastic leukemia in Isfahan, Iran. J Res Med Sci 2009;14:111-6.
- Huffman FG, Kanikireddy S, Patel M. Parenthood – A contributing factor to childhood obesity. Int J Environ Res Public Health 2010;7:2800-10.
| Figure 1: Mean values of body mass index in childhood acute lymphoblastic leukemia survivors during 36 months follow-up
References
- Ness KK, Armenian SH, Kadan-Lottick N, Gurney JG. Adverse effects of treatment in childhood acute lymphoblastic leukemia: General overview and implications for long-term cardiac health. Expert Rev Hematol 2011;4:185-97.
- Iughetti L, Bruzzi P, Predieri B, Paolucci P. Obesity in patients with acute lymphoblastic leukemia in childhood. Ital J Pediatr 2012;38:4.
- Robison LL. Late effects of acute lymphoblastic leukemia therapy in patients diagnosed at 0-20 years of age. Hematology Am Soc Hematol Educ Program 2011;2011:238-42.
- TB, Mosher RB, Reaman GH. Late effects in long-term survivors after treatment for childhood acute leukemia. Clin Pediatr (Phila) 2009;48:601-8.
- Withycombe JS, Post-White JE, Meza JL, Hawks RG, Smith LM, Sacks N, et al. Weight patterns in children with higher risk ALL: A report from the Children's Oncology Group (COG) for CCG 1961. Pediatr Blood Cancer 2009;53:1249-54.
- Pakakasama S, Veerakul G, Sosothikul D, Chainansamit SO, Laosombat V, Thanarattanakorn P, et al. Late effects in survivors of childhood acute lymphoblastic leukemia: A study from Thai Pediatric Oncology Group. Int J Hematol 2010;91:850-4.
- Wallace AM, Tucker P, Williams DM, Hughes IA, Ahmed SF. Short-term effects of prednisolone and dexamethasone on circulating concentrations of leptin and sex hormone-binding globulin in children being treated for acute lymphoblastic leukaemia. Clin Endocrinol (Oxf) 2003;58:770-6.
- Skoczen S, Tomasik PJ, Bik-Multanowski M, Surmiak M, Balwierz W, Pietrzyk JJ, et al. Plasma levels of leptin and soluble leptin receptor and polymorphisms of leptin gene -18G>A and leptin receptor genes K109R and Q223R, in survivors of childhood acute lymphoblastic leukemia. J Exp Clin Cancer Res 2011;30:64.
- Kuczmarski RJ, Ogden CL, Guo SS, Grummer-Strawn LM, Flegal KM, Mei Z, et al. 2000 CDC Growth Charts for the United States: Methods and development. Vital Health Stat 11 2002;246:1-190.
- ;Available from: http://www.cdc.gov/growthcharts/clinical_charts.htm. [Last accessed 2016 Mar 28].
- Expert Panel on Detection, Evaluation, and Treatment of High Blood Cholesterol in Adults. Executive Summary of the Third Report of the National Cholesterol Education Program (NCEP) Expert Panel on Detection, Evaluation, and Treatment of High Blood Cholesterol in Adults (Adult Treatment Panel III). JAMA 2001;285:2486-97.
- Weiss R, Dziura J, Burgert TS, Tamborlane WV, Taksali SE, Yeckel CW, et al. Obesity and the metabolic syndrome in children and adolescents. N Engl J Med 2004;350:2362-74.
- Lamerz A, Kuepper-Nybelen J, Wehle C, Bruning N, Trost-Brinkhues G, Brenner H, et al. Social class, parental education, and obesity prevalence in a study of six-year-old children in Germany. Int J Obes (Lond) 2005;29:373-80.
- Zhang LD, Li YH, Ke ZY, Huang LB, Luo XQ. Obesity as the initial manifestation of central nervous system relapse of acute lymphoblastic leukemia: Case report and literature review. J Cancer Res Ther 2012;8:151-3.
- Aldhafiri F, Al-Nasser A, Al-Sugair A, Al-Mutairi H, Young D, Reilly JJ. Obesity and metabolic syndrome in adolescent survivors of standard risk childhood acute lymphoblastic leukemia in Saudi Arabia. Pediatr Blood Cancer 2012;59:133-7.
- Jansen H, Postma A, Stolk RP, Kamps WA. Acute lymphoblastic leukemia and obesity: Increased energy intake or decreased physical activity? Support Care Cancer 2009;17:103-6.
- Szymon S, Bik-Multanowski M, Balwierz W, Pietrzyk JJ, Surmiak M, Strojny W, et al. Homozygosity for the rs9939609T allele of the FTO gene may have protective effect on becoming overweight in survivors of childhood acute lymphoblastic leukaemia. J Genet 2011;90:365-8.
- Collins L, Zarzabal LA, Nayiager T, Pollock BH, Barr RD. Growth in children with acute lymphoblastic leukemia during treatment. J Pediatr Hematol Oncol 2010;32:e304-7.
- Gofman I, Ducore J. Risk factors for the development of obesity in children surviving ALL and NHL. J Pediatr Hematol Oncol 2009;31:101-7.
- Butturini AM, Dorey FJ, Lange BJ, Henry DW, Gaynon PS, Fu C, et al. Obesity and outcome in pediatric acute lymphoblastic leukemia. J Clin Oncol 2007;25:2063-9.
- Wex H, Ponelis E, Wex T, Dressendörfer R, Mittler U, Vorwerk P. Plasma leptin and leptin receptor expression in childhood acute lymphoblastic leukemia. Int J Hematol 2002;76:446-52.
- Ethier MC, Alexander S, Abla O, Green G, Lam R, Sung L. Association between obesity at diagnosis and weight change during induction and survival in pediatric acute lymphoblastic leukemia. Leuk Lymphoma 2012;53:1677-81.
- Asner S, Ammann RA, Ozsahin H, Beck-Popovic M, von der Weid NX. Obesity in long-term survivors of childhood acute lymphoblastic leukemia. Pediatr Blood Cancer 2008;51:118-22.
- Razzouk BI, Rose SR, Hongeng S, Wallace D, Smeltzer MP, Zacher M, et al. Obesity in survivors of childhood acute lymphoblastic leukemia and lymphoma. J Clin Oncol 2007;25:1183-9.
- Tonorezos ES, Vega GL, Sklar CA, Chou JF, Moskowitz CS, Mo Q, et al. Adipokines, body fatness, and insulin resistance among survivors of childhood leukemia. Pediatr Blood Cancer 2012;58:31-6.
- Garmey EG, Liu Q, Sklar CA, Meacham LR, Mertens AC, Stovall MA, et al. Longitudinal changes in obesity and body mass index among adult survivors of childhood acute lymphoblastic leukemia: A report from the Childhood Cancer Survivor Study. J Clin Oncol 2008;26:4639-45.
- Esbenshade AJ, Simmons JH, Koyama T, Lindell RB, Friedman DL. Obesity and insulin resistance in pediatric acute lymphoblastic leukemia worsens during maintenance therapy. Pediatr Blood Cancer 2013;60:1287-91.
- Reisi N, Azhir A, Hashemipour M, Raeissi P, Amini A, Moafi A. The metabolic syndrome in survivors of childhood acute lymphoblastic leukemia in Isfahan, Iran. J Res Med Sci 2009;14:111-6.
- Huffman FG, Kanikireddy S, Patel M. Parenthood – A contributing factor to childhood obesity. Int J Environ Res Public Health 2010;7:2800-10.