 PDF
PDF  Views
Views  Share
Share


Incidence and Spectrum of Childhood Tumors: A Three-Year Hospital-Based Registry Review from a Tertiary Center in Patna
CC BY 4.0 · Indian J Med Paediatr Oncol 2026; 47(03): 218-225
DOI: DOI: 10.1055/s-0046-1818555
Abstract
Introduction
Childhood cancers, though relatively uncommon, remain a leading cause of mortality and morbidity among children in low- and middle-income countries. Reliable epidemiological data from Eastern India, particularly from Bihar, remain limited. Despite the recent initiation of a population-based cancer registry (PBCR) in Bihar in 2018, its nonstatewide coverage hinders a comprehensive assessment of the disease burden and resource allocation for the entire region.
Objectives
To describe the incidence, spectrum, and demographic distribution of childhood tumors at a tertiary care center in Patna, Bihar, India, and to estimate the crude incidence rate (CIR) and age-standardized incidence rate (ASIR).
Materials and Methods
A hospital-based cancer registry analysis was conducted at a tertiary care referral center in Patna, between January 2023 and September 2025. All newly diagnosed tumors in individuals aged 0 to 19 years (pediatric age group), confirmed histologically, cytologically, or by multidisciplinary consensus, were included. Malignancies were classified according to the International Classification of Childhood Cancer, third edition. Incidence rates were computed using the projected pediatric population of Patna, derived from the 2011 Census, and expressed as CIR and ASIR (per million person-years) with 95% confidence intervals (CI).
Results.
Among 798 included patients, 756 (94.7%) had malignant and 42 (5.3%) benign tumors. The mean age at diagnosis was 7.5 ± 4.4 years, with a marked male predominance (M:F = 1.77:1). Solid malignancies (59.7%) outnumbered hematological malignancies (40.3%). The most common cancers were acute lymphoblastic leukemia (14.7%), Hodgkin lymphoma (13.4%), and retinoblastoma (11.4%). Among Patna-resident cases (n = 537), the CIR was 100.5 per million (95% CI: 93.2–107.8) and the ASIR was 106.5 per million. The highest age-specific incidence occurred in the <5>
Conclusion
This hospital registry study at Patna reveals a substantial pediatric cancer burden, with a predominance of solid malignancies and a significant male excess. The observed high frequency of retinoblastoma and Hodgkin lymphoma, along with elevated CIR and ASIR values, underscores the urgent need for expanded PBCR coverage to accurately capture the disease burden and inform pediatric oncology planning in the region.
Keywords
pediatric tumors - incidence rate - hematologic malignancies - solid malignancies - Bihar - cancer registry
Authors' Contributions
S.A. participated in study design, methodology, data interpretation, statistical analysis, patient recruitment, clinical data acquisition, follow-up, literature review, and support in manuscript drafting. P.B. was responsible for the concept and study design, methodology, data interpretation, statistical analysis, patient recruitment, critical revision of the manuscript, and supervision. R.K. contributed to the conceptualization, study design, clinical data acquisition, follow-up, data curation, and drafting the manuscript. N.K. was involved in conceptualization, study design, methodology, patient recruitment, and clinical data acquisition. Z.H. contributed to the conceptualization, statistical analysis, patient recruitment, clinical data acquisition, and follow-up. V.K.T. was responsible for data interpretation, statistical analysis, drafting the manuscript, and critical revision. R.R. participated in methodology, data interpretation, statistical analysis, and patient recruitment. R.K.S. contributed to conceptualization, study design, methodology, data interpretation, statistical analysis, data curation, and supervision. A.G. was involved in statistical analysis, critical revision of the manuscript, and supervision. J.P. was responsible for conceptualization, study design, methodology, data interpretation, statistical analysis, data curation, literature review, and support in manuscript drafting. All authors have read and approved the final version of the manuscript.
Patient Consent
Given the retrospective design of the study and the use of anonymized, de-identified data from the hospital-based cancer registry, the requirement for obtaining consent from patients or their legal guardians was waived.
Ethical Approval
Ethical clearance was obtained from the Institutional Ethics Committee of Indira Gandhi Institute of Medical Sciences, Patna, Bihar, Approval No: 28/IEC/IGIMS/2024.
Publication History
Article published online:
14 March 2026
© 2026. The Author(s). This is an open access article published by Thieme under the terms of the Creative Commons Attribution License, permitting unrestricted use, distribution, and reproduction so long as the original work is properly cited. (https://creativecommons.org/licenses/by/4.0/)
Thieme Medical and Scientific Publishers Pvt. Ltd.
A-12, 2nd Floor, Sector 2, Noida-201301 UP, India
We recommend
- Geographical pattern of carcinoma gallbladder in Bihar and its association with river Ganges and arsenic levels: Retrospective individual consecutive patient da...Richa Madhawi, South Asian Journal of Cancer, 2018
- Epidemiological Profiling and Trends of Primary Intracranial Tumors: A Hospital-Based Brain Tumor Registry from a Tertiary Care CenterMukta Meel, Journal of Neurosciences in Rural Practice, 2021
- Analysis of Pediatric Burns in A Tertiary Burns Center in Istanbul, TurkeyF. Uygur, European Journal of Pediatric Surgery, 2009
- Clinico-Hematological Profile of Acute Leukemia Cases in Bihar: A Multiparameter Study in a Tertiary-Care HospitalShuchismita Shuchismita, et al., J Lab Physicians, 2022
- Adrenal Tumors in Children: Spectrum of Presentation and Surgical Approach in a Tertiary Care InstitutePrasanta Kumar Tripathy, TH Open, 2020
- Childhood tuberculosis in Israel: epidemiological trends and treatment outcomes, 1999–2010<svg viewBox="0 0 24 24" fill="none" xmlns="http://www.w3.org/2000/svg">
</svg> Zohar Mor, European Respiratory Journal, 2013 - Spectrum of childhood interstitial and diffuse lung diseases at a tertiary hospital in EgyptSalma G. Abdelhady, ERJ Open Res, 2021
- Registries for paediatric pulmonary hypertensionGeorg Hansmann, European Respiratory Journal, 2013
- Early life exposure to pollens and increased risks of childhood asthma: a prospective cohort study in Ontario childrenCristina Stanescu, European Respiratory Journal, 2024
- Safety and practices during stress cardiac magnetic resonance in COPD: A 3-year experience from a tertiary referral centreIan S. Stone, European Respiratory Journal, 2013
Abstract
Introduction
Childhood cancers, though relatively uncommon, remain a leading cause of mortality and morbidity among children in low- and middle-income countries. Reliable epidemiological data from Eastern India, particularly from Bihar, remain limited. Despite the recent initiation of a population-based cancer registry (PBCR) in Bihar in 2018, its nonstatewide coverage hinders a comprehensive assessment of the disease burden and resource allocation for the entire region.
Objectives
To describe the incidence, spectrum, and demographic distribution of childhood tumors at a tertiary care center in Patna, Bihar, India, and to estimate the crude incidence rate (CIR) and age-standardized incidence rate (ASIR).
Materials and Methods
A hospital-based cancer registry analysis was conducted at a tertiary care referral center in Patna, between January 2023 and September 2025. All newly diagnosed tumors in individuals aged 0 to 19 years (pediatric age group), confirmed histologically, cytologically, or by multidisciplinary consensus, were included. Malignancies were classified according to the International Classification of Childhood Cancer, third edition. Incidence rates were computed using the projected pediatric population of Patna, derived from the 2011 Census, and expressed as CIR and ASIR (per million person-years) with 95%, confidence intervals (CI).
Results.
Among 798 included patients, 756 (94.7%) had malignant and 42 (5.3%) benign tumors. The mean age at diagnosis was 7.5 ± 4.4 years, with a marked male predominance (M:F = 1.77:1). Solid malignancies (59.7%) outnumbered hematological malignancies (40.3%). The most common cancers were acute lymphoblastic leukemia (14.7%), Hodgkin lymphoma (13.4%), and retinoblastoma (11.4%). Among Patna-resident cases (n = 537), the CIR was 100.5 per million (95% CI: 93.2–107.8) and the ASIR was 106.5 per million. The highest age-specific incidence occurred in the <5>
Conclusion
This hospital registry study at Patna reveals a substantial pediatric cancer burden, with a predominance of solid malignancies and a significant male excess. The observed high frequency of retinoblastoma and Hodgkin lymphoma, along with elevated CIR and ASIR values, underscores the urgent need for expanded PBCR coverage to accurately capture the disease burden and inform pediatric oncology planning in the region.
Keywords
pediatric tumors - incidence rate - hematologic malignancies - solid malignancies - Bihar - cancer registry
Introduction
Childhood cancers, though relatively uncommon compared with adult malignancies, represent a major global health concern because of their disproportionate contribution to childhood mortality and long-term morbidity. An estimated 280,000 children aged 0 to 14 years are newly diagnosed with cancer worldwide each year, nearly one-fifth of whom live in India.[1] While advances in diagnostics and standardized treatment protocols have resulted in survival rates exceeding 80%, in high-income countries (HICs),[2] survival rates in many low- and middle-income countries (LMICs) remain only 30 to 40%.[3] These highlight profound inequities in access to timely diagnosis and specialized care. This disparity is evident within India, where outcomes at specialized pediatric oncology centers are substantially better than those reported from other healthcare settings.[4]
Accurate epidemiological data are essential for effective cancer control planning; however, major gaps persist across much of South Asia, including Bihar. Although India's National Cancer Registry Program (NCRP) has expanded since 1982, population-based cancer registries (PBCRs) still cover less than 10%, of the population.[5] A PBCR was established in Bihar in 2018, but its restriction to a single district limits its ability to capture the statewide pediatric cancer burden. Consequently, the true incidence and spectrum of childhood malignancies in Bihar remain inadequately defined, constraining evidence-based health planning and national policy formulation.
Bihar, with a population of approximately 104 million in 2011 and Patna district accounting for approximately 5.84 million inhabitants,[6] has limited pediatric oncology infrastructure, with only a few tertiary cancer centers concentrated largely in Patna. Its distinctive demographic and socioeconomic context—marked by high population density, constrained healthcare resources, and gender disparities in access to care—makes it a critical setting for studying childhood cancer epidemiology. Understanding the regional tumor profile is therefore essential not only to address state-level data gaps but also to contribute to the broader understanding of pediatric cancers in low-resource settings, where survival disparities remain most pronounced.
Although pediatric cancers account for approximately 5%, of India's overall cancer burden,[7] reliable data remain scarce, particularly in states such as Bihar. In the absence of comprehensive PBCR coverage, hospital-based cancer registries (HBCRs) provide an important interim source of systematically collected information, offering insights into disease patterns, referral dynamics, and approximate incidence burden within defined catchment areas. Against this background, the present study was undertaken to describe the incidence patterns, tumor spectrum, and demographic distribution of childhood and adolescent cancers diagnosed at a major tertiary care center in Patna, Bihar, and to estimate crude and age-standardized incidence rates (CIR and ASIR), as well as an approximate annual pediatric cancer burden among Patna-resident children, to inform regional pediatric oncology planning.
Objectives
Primary objective: to describe the incidence, spectrum, and demographic distribution of childhood and adolescent tumors diagnosed at a tertiary cancer center in Patna, Bihar, India.
Secondary objectives: to estimate the crude incidence rate (CIR) and ASIR among Patna-resident cases, and to examine the age-, sex-, and temporal distribution of major pediatric malignancies identified.
Materials and Methods
Study design and setting: this was a hospital-based descriptive analysis of childhood and adolescent tumors diagnosed between January 2023 and September 2025 at a tertiary care hospital in Patna, Bihar, India. The institute includes a Regional Institute of Ophthalmology, oncology services, and a multidisciplinary pediatric cancer unit, ensuring broad referral coverage across the state.
Participants and case definition: all newly diagnosed tumors in individuals aged 0 to 19 years registered in the HBCR during the study period were eligible. This age range was chosen in accordance with the International Classification of Childhood Cancer, third edition (ICCC-3),[8] which includes adolescents up to 19 years and is widely used in pediatric cancer epidemiology-based studies. The case was included if the diagnosis was histologically or cytologically confirmed. In cases lacking a tissue diagnosis, radiological and clinical findings (including imaging and tumor markers) were used, with final adjudication by a multidisciplinary tumor board. Patients with recurrent disease or incomplete diagnostic confirmation were excluded. Pediatric malignancies were classified using the ICCC-3.[8]
Data sources and variables: data were extracted from the HBCR, which is prospectively maintained by trained registry personnel using a standardized abstraction form. Information was obtained from pathology reports, inpatient and outpatient medical records, discharge summaries, and departmental notifications from oncology, pediatrics, neurosurgery, pediatric surgery, ophthalmology, and radiotherapy units. For each case, demographic details (age, sex, and district) and tumor characteristics (anatomical site, morphology, and ICCC-3 classification) were recorded, along with year of diagnosis and method of confirmation. Registry staff routinely cross-checked departmental logbooks and pathology registers to ensure completeness and accuracy. Data were verified for internal consistency before analysis, and duplicate registrations were removed.
Sample size: all eligible pediatric cases registered between January 2023 and September 2025 were included. A formal sample size calculation was not performed as the study constituted a census of all patients presenting to the tertiary center during this period, which is standard practice for descriptive, hospital-based registry studies.
Statistical analysis: categorical variables were summarized as frequencies and percentages. Sex distribution across tumor categories was assessed using two-sided binomial tests, and the results were expressed as male-to-female ratios with 95%, confidence intervals (CI) and p-values. For diagnostic groups with fewer than five cases, only descriptive counts are reported. In the absence of individual-level exposure data, age-specific incidence rates and sex-specific incidence patterns were used as surrogate measures of differential cancer risk across pediatric subgroups, consistent with standard epidemiological practice in descriptive registry-based studies. Male-to-female ratios and corresponding p-values from two-sided binomial tests were used to explore sex-related variation in cancer distribution.
Incidence rates were calculated using the projected pediatric (0–19 years) population of Patna as the denominator. Cases from other districts were included in descriptive analyses but excluded from incidence calculations. Incidence measures were calculated using three complementary approaches. The CIR was defined as the number of newly diagnosed malignancies in individuals aged 0 to 19 years, divided by the corresponding mid-year population of Patna district and expressed per million person-years; this calculation included only the 71%, of total registered cases who were confirmed residents (n = 537). Age-specific incidence rates were calculated for standard age groups (<5 href="https://www.thieme-connect.com/products/ejournals/html/10.1055/s-0046-1818555#JR252782348-9" xss=removed>9] Finally, the ASIR for the 0 to 19 year population was estimated by the direct method, using the World Standard Population (2000–2025 revision) as reference.[10] For CIR, 95%, CIs were calculated assuming a Poisson distribution. Additionally, to estimate the expected annual burden of childhood cancer for service planning purposes, the observed ASIR was applied to the projected pediatric (0–19 years) population of Patna, derived from the 2011 Census, to obtain an approximate annual number of new cancer cases.
Temporal trends were examined by comparing annual case registrations across the three study years. All analyses were performed using IBM SPSS Statistics, version 25.0 (IBM Corp., Armonk, New York, United States). No adjustments were made for multiple comparisons; p-values are interpreted as exploratory.
Ethical considerations: the study was conducted in accordance with the Declaration of Helsinki and the national guidelines for biomedical research. The HBCR was approved by the Institutional Ethics Committee of the participating institution. As a registry-based analysis of de-identified data, the requirement for individual informed consent was waived.
Results
Study population: a total of 798 pediatric patients were included in the study, comprising 756 malignant tumors (94.7%) and 42 benign tumors (5.3%). The mean age at diagnosis was 7.46 years (SD: 4.44). The distribution across age groups was as follows: 1 to <5 class="i" xss=removed>n = 756) rose from 201 cases (26.5%) to 288 (38.1%) in 2024, with 267 (35.3%) recorded by September 2025.
Incidence rates: among Patna-resident cases (n = 537), the overall CIR for childhood malignancies (0–19 years) was 100.5 per million person-years (95% CI: 93.2–107.8). The ASIR (calculated by the direct method using the WHO World Standard Population 2000–2025) was 106.5 per million. The highest age-specific incidence rate was observed in the <5 href="https://www.thieme-connect.com/products/ejournals/html/10.1055/s-0046-1818555#TB252782348-1" xss=removed>Table 1])
Using this observed ASIR and applying it to the projected pediatric (0–19 years) population of Patna, the expected annual burden of childhood cancer was estimated at approximately 180 to 200 new cases. This ASIR-based estimate is consistent with the observed average annual case registration from Patna-resident children during the study period and provides a pragmatic approximation of case load for regional service planning.
Distribution by diagnostic group: a total of 42 benign tumors were recorded during the study period. These included adrenal adenoma (n = 2), congenital mesoblastic nephroma (n = 1), fibroma (n = 1), and juvenile nasal angiofibroma (n = 2). A total of 11 benign CNS tumors were observed, consisting of craniopharyngioma (n = 5), meningioma (n = 2), choroid plexus papilloma (n = 1), pituitary adenoma (n = 1), subependymal giant cell astrocytoma (n = 1), and dysembryoplastic neuroepithelial tumor (n = 1). Benign bone tumors (n = 16) comprised aneurysmal bone cyst (n = 7), osteoid osteoma (n = 3), enchondroma (n = 1), chondroblastoma (n = 1), osteochondroma (n = 1), and giant cell tumor of bone (n = 3). Peripheral nerve sheath benign tumors (n = 9) included neurofibroma (n = 5), schwannoma (n = 3), and ganglioneuroma (n = 1).
Of the 756 malignant cases, solid malignancies (451; 59.7%) outnumbered hematological malignancies (305; 40.3%). Hematologic malignancies were dominated by acute lymphoblastic leukemia (ALL; n = 111), followed by Hodgkin's lymphoma (HL; n = 101), non-Hodgkin lymphoma (NHL; n = 41), acute myeloid leukemia (AML; n = 34), and chronic myeloid leukemia (CML; n = 18). ALL (36.4%) and HL (33.1%) together constituted the majority. Among solid malignancies, the most frequent were retinoblastoma (86, 11.4%), central nervous system (CNS) tumor (66, 8.7%), Wilms' tumor (51, 6.7%), Ewing's sarcoma (38, 5.0%), osteosarcoma (37, 4.9%), and neuroblastoma (36, 4.8%). Other reported tumors included germ cell tumors (35, 4.6%), soft tissue sarcoma (34, 4.4%), rhabdomyosarcoma (18, 2.4%), hepatoblastoma (9, 1.2%), and nasopharyngeal carcinoma (3, 0.4%). Within CNS tumors (n = 66), the most frequent subtypes were medulloblastoma (n = 22), ependymoma (n = 14), gliomas (n = 13), and astrocytomas (n = 13). ([Table 2])
|
Malignancy types |
Total; n (%) |
Male; n (%) |
Female; n (%) |
p-Value |
|---|---|---|---|---|
|
1. Solid malignancies (n = 451) |
||||
|
Central Nervous System |
66 (8.7) |
43 |
23 |
|
|
Medulloblastoma |
22 (33.3%) |
10 (45.5%) |
12 (54.5%) |
0.831 |
|
Ependymoma |
14 (21.2%) |
12 (85.7%) |
2 (14.3%) |
0.012[b] |
|
Glioma |
13 (19.7%) |
9 (69.2%) |
4 (30.8%) |
0.260 |
|
Astrocytoma |
13 (19.7%) |
8 (61.5%) |
5 (38.5%) |
0.581 |
|
Pineoblastoma |
4 (6.1%) |
4 (100%) |
0 (0%) |
[a] |
|
Retinoblastoma |
86 (19.06%) |
44 (51.2%) |
42 (48.8%) |
0.914 |
|
Wilms' tumor |
51 (11.3%) |
34 (66.7%) |
17 (33.3%) |
0.024[b] |
|
Ewing's sarcoma |
38 (8.4%) |
28 (73.7%) |
10 (26.3%) |
0.005[b] |
|
Osteosarcoma |
37 (8.2%) |
19 (51.4%) |
18 (48.6%) |
1.000 |
|
Neuroblastoma |
36 (7.9%) |
21 (58.3%) |
15 (41.7%) |
0.405 |
|
Germ cell tumor |
35 (7.7%) |
15 (42.9%) |
20 (57.1%) |
0.499 |
|
Soft tissue sarcoma |
34 (7.5%) |
21 (61.8%) |
13 (38.2%) |
0.229 |
|
Rhabdomyosarcoma |
18 (3.9%) |
14 (77.8%) |
4 (22.2%) |
0.030[b] |
|
Hepatoblastoma |
9 (1.9%) |
4 (44.4%) |
5 (55.6%) |
1.000 |
|
Sacrococcygeal teratoma |
6 (1.3%) |
3 (50.0%) |
3 (50.0%) |
[a] |
|
Nasopharyngeal carcinoma |
3 (0.6%) |
2 (66.7%) |
1 (33.3%) |
[a] |
|
Parotid carcinoma |
3 (0.6%) |
2 (66.7%) |
1 (33.3%) |
[a] |
|
Carcinoma ovary |
3 (0.6%) |
3 (100%) |
0 (0%) |
[a] |
|
Other solid malignancies[c] |
26 (5.7%) |
12 (46.2%) |
14 (53.8%) |
– |
|
2. Hematological malignancies (n = 305) |
||||
|
Acute lymphoblastic leukemia (ALL) |
111 (36.4%) |
76 (68.5%) |
35 (31.5%) |
<0 href="#FN252782348-3">b] |
|
Hodgkin lymphoma (HL) |
101 (33.1%) |
85 (84.2%) |
16 (15.8%) |
<0 href="#FN252782348-3" class="alt">b] |
|
Non-Hodgkin lymphoma (NHL) |
41 (13.4%) |
28 (68.3%) |
13 (31.7%) |
0.027[b] |
|
Acute myeloid leukemia (AML) |
34 (11.1%) |
19 (55.9%) |
15 (44.1%) |
0.607 |
|
Chronic myeloid leukemia (CML) |
18 (5.9%) |
8 (44.4%) |
10 (55.6%) |
0.814 |
Note: Percentages within subcategories are calculated relative to the respective subgroup totals (CNS, hematological). p-Values from binomial test with null hypothesis of equal sex distribution (0.5).
a Indicates p-value not calculated due to small sample size (n < 5).
b Statistically significant.
c Other solid malignancies include: adrenal carcinoma (1), lung carcinoma (1), renal carcinoma (2), carcinoma anorectum (2), carcinoma buccal mucosa (1), carcinoma gallbladder (1), carcinoma rectum (1), carcinoma submandibular gland (1), clear cell sarcoma of kidney (2), carcinoma transverse colon (1), carcinoma urinary bladder (1), cholangiocarcinoma (1), colon cancer (1), extraadrenal paraganglioma (1), Gastrointestinal stromal tumor (1), hemangioendothelioma (1), pancreatic carcinoma (1), thymoma (1), testicular tumor (2), thyroid carcinoma (1), pleuropulmonary blastoma (1), synovial sarcoma (1).
Sex Distribution of Malignancies: the sex distribution of malignancies varied significantly by type.
Statistical analysis showed a significantly higher risk in males' predominance in cases of ALL (p = 0.0001), HL (p < 0.0001), NHL (p = 0.0275), Wilms' tumor (p = 0.0241), rhabdomyosarcoma (p = 0.0308), and Ewing's sarcoma (p = 0.0051). However, the incidence of AML, CML, retinoblastoma, osteosarcoma, germ cell tumors, and neuroblastoma showed no significant difference between sexes ([Table 2]).
Age Distribution of Malignancies: the age-wise analysis showed that retinoblastoma (69.8%, of its cases), neuroblastoma (77.7%), Wilms' tumor (76.4%), hepatoblastoma (100%) and rhabdomyosarcoma (61.1%) occurred predominantly in children below 5 years, while osteosarcoma (70.2%), Ewing's sarcoma (39.4%), NHL (58.5%), and HL (51.4%) were most common in the 10 to <15 class="i" xss=removed>n = 6), neuroblastoma (n = 2), Wilms' tumor (n = 1), and hepatoblastoma (n = 1), highlighting that certain embryonal tumors can arise as early as the first year of life ([Fig. 1]).
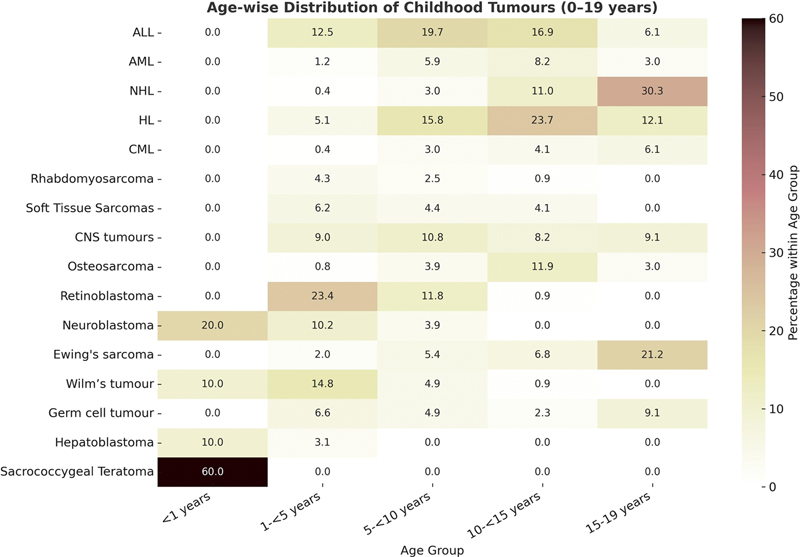
Fig 1: Heat-map illustrating the proportional distribution of major childhood cancers by age groups. Note: Each value indicates the percentage of that cancer type within the corresponding age category, with darker shades representing higher proportions. ALL, acute lymphoblastic leukemia; AML, acute myeloid leukemia; CML, Chronic myeloid leukemia); HL, Hodgkin lymphoma; NHL, non-Hodgkin lymphoma.
Time trends: the temporal analysis of the top five malignancies revealed distinct patterns: retinoblastoma cases exhibited a substantial increase, more than doubling from 2023 (n = 21) to 2025 (n = 44). In contrast, the incidence of ALL, HL, Wilms' tumor, and CNS tumors demonstrated modest fluctuations across the study period ([Fig. 2])
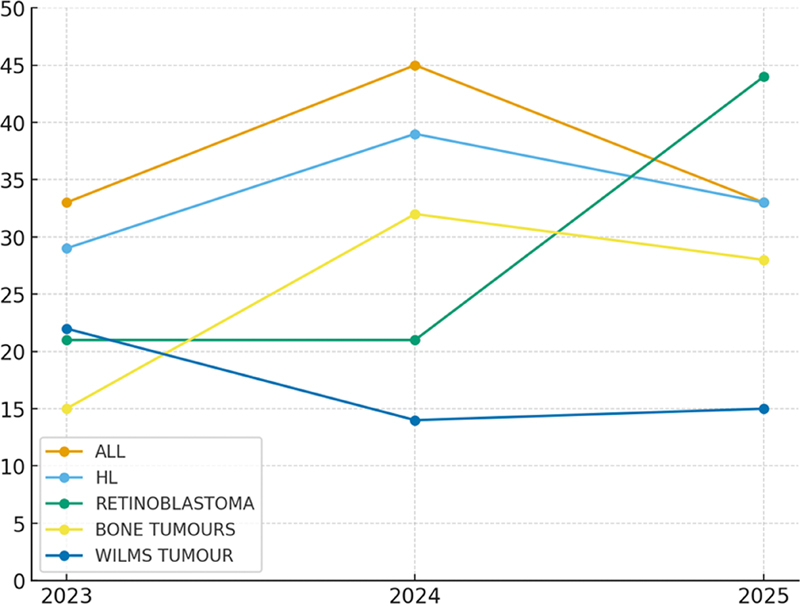
Fig 2: Time trends of the top five pediatric malignancies (2023–2025) from the hospital-based cancer registry (HBCR). ALL, acute lymphoblastic leukemia; HL, Hodgkin lymphoma.
Discussion
This single-center study reveals a substantial number of pediatric cancer cases presenting to a tertiary facility in Bihar, a state representing a large and underserved population with historically limited cancer surveillance infrastructure in Eastern India. Study findings delineate a substantial and heterogeneous pediatric cancer burden, characterized by a predominance of solid tumors, a distinct age and sex distribution, and high crude and ASIR. Together, these findings reflect both biological tumor patterns and systemic inequities in diagnostic access and referral pathways that shape the regional cancer landscape. The over predominance of solid malignancies (59.7%) over hematological cancers (40.3%) contrasts with data from HICs, where leukemias remain the most common childhood cancers, often exceeding 30 to 40%, of total cases.[11] However, this pattern aligns with trends reported from other LMICs, including India,[12] suggesting that underdiagnosis of leukemia in peripheral settings, delayed presentation, and incomplete diagnostic confirmation continue to influence registry profiles. The over-representation of solid tumors also reflects Bihar's healthcare structure, where late-stage presentations are often referred to tertiary centers for surgical or oncological management, whereas hematological malignancies may be underrepresented due to early attrition or incomplete reporting.
Acute lymphoblastic leukemia (ALL) remained the single most common malignancy (14.7%), corroborating global and national patterns.[3] [13] [14] The high proportion of Hodgkin lymphoma (13.4%) in our cohort exceeds the 7 to 12%, range typically reported in other Indian studies.[15] [16] This may represent a genuine regional variation or better diagnostic ascertainment due to institutional haemato-pathology services.
The strikingly elevated frequency of retinoblastoma (11.4%), more than double the typical proportion reported in broader epidemiological studies (3–5%),[3] is plausibly attributable to the hospital's dedicated ophthalmology department, which serves as a major referral center. Nonetheless, similar high frequencies have been reported from other tertiary institutions in South Asia[17] [18] reflecting both improved detection and a continuing burden of embryonal tumors in early childhood.
Central nervous system (CNS) tumors (8.7%) were underrepresented relative to global data, where they account for 20 to 25%, of childhood malignancies.[3] This underdiagnosis is a recognized limitation in India and other LMIC contexts, often linked to limited advanced neuroimaging (MRI and CT scans) access, diagnostic delays, and neurosurgical constraints.[3] [19]
The age-related distribution of tumors was consistent with biological principles of pediatric oncogenesis. Embryonal tumors such as retinoblastoma, hepatoblastoma, neuroblastoma, Wilms' tumor, and rhabdomyosarcoma clustered among children below five years of age,[20] [21] while lymphomas and bone sarcomas predominated in those aged 10 to 14 years.[22]
Notably, ALL exhibited a broader age distribution without the classic early childhood peak (2–5 years) observed in Western cohorts.[23] This shift, reported also in other Indian series[19] may reflect diagnostic and referral delays, resulting in a disproportionate representation of older children at tertiary facilities.
A prominent and recurring finding across Indian and LMIC data is the male excess in pediatric cancer registration.[24] [25] Our study recorded a male-to-female ratio of 1.77:1, significantly higher than in HICs (1.2:1) and the national average (1.6:1). The sex disparity was particularly pronounced for ALL, HL, NHL, Wilms' tumor, and Ewing sarcoma. While minor biological differences in susceptibility have been described,[25] the magnitude of imbalance in Bihar likely reflects entrenched sociocultural and structural factors. Preferential healthcare seeking for boys and under-recognition of disease among girls remain well-documented phenomena in Northern India.[26] This gender gap has direct implications for cancer registration, policy design, and targeted awareness interventions aimed at equitable pediatric cancer care.
The age-standardized ASIR of 106.5 per million observed at a major tertiary care center in Patna lies at the upper range of national PBCR estimates (38–124 per million).[5] [25] Although partly influenced by referral bias inherent to tertiary-level care, this high rate suggests that the true childhood cancer burden in Bihar is likely substantial and underreported. Consistent with this, the ASIR-based estimate of approximately 180 to 200 new pediatric cancer cases annually among Patna-resident children reflects the expected clinical workload in the district. The absence of statewide PBCR coverage until recently has limited accurate surveillance, strategic resource allocation, and outcome evaluation; while the establishment of Bihar's first PBCR is a major advance, its expansion to full-state coverage remains essential for reliable population-based estimation of cancer burden and temporal trends. Integration of hospital-based and PBCR data, using harmonized classification systems such as ICCC-3,[8] will further strengthen data comparability and inform pediatric oncology planning.
Strengths, Limitations, and Future Directions
This study comprehensively captured detailed demographic and diagnostic information over a defined period, enabling a reliable description of the spectrum and distribution of childhood and adolescent malignancies presented to a major tertiary care center in Patna, Bihar, a region with historically limited population-based cancer surveillance. Key strengths include the use of systematically collected HBCR data, standardized case classification according to the ICCC-3, and inclusion of adolescents up to 19 years of age, facilitating comparability with national and international pediatric cancer epidemiology. The substantial case volume and detailed age- and sex-specific analyses further enhance the robustness of the descriptive findings.
Several limitations should be acknowledged. The single-center, hospital-based design may over-represent certain tumor types and underestimate others, and therefore, the findings may not be generalizable beyond the referral population of this institution. Referral bias, the lack of outcome follow-up, and exclusion of cases without diagnostic confirmation may have influenced the observed case mix. In addition, because this HBCR did not collect individual-level exposure, socioeconomic, or environmental data, formal assessment of etiologic risk factors, multivariable risk modeling, and causal inference analyses were not feasible; accordingly, the study is limited to describing incidence patterns rather than identifying determinants of cancer risk. We have therefore avoided extrapolating these incidence rates to the whole of Bihar, as population coverage remains incomplete, and diagnoses occurring outside this center are not captured.
Despite these limitations, the study provides important interim epidemiological insights into pediatric cancer burden in an underserved region. The observed incidence patterns and age-standardized rates suggest that a substantial proportion of childhood cancers in Bihar may remain underreported. Strengthening statewide PBCR coverage, improving linkage between hospital-based and population-based registries, and expanding pediatric oncology capacity beyond Patna are essential future priorities. In parallel, equitable access to pediatric oncology care supported by government-funded financial protection schemes such as Ayushman Bharat and Rashtriya Arogya Nidhi remains critical for improving survival outcomes and reducing diagnostic delays. Long-term, multi-centric studies with enhanced data capture and follow-up are needed to better understand survival trends, treatment gaps, and regional disparities in pediatric cancer care.
Conclusion
This study outlines the childhood cancer profile at a major tertiary center in Patna, Bihar, highlighting a high burden of solid malignancies and a pattern broadly like national trends. Notably, the elevated frequency of retinoblastoma and Hodgkin lymphoma, the atypical age distribution of ALL, and marked gender disparities underscore the region-specific challenges. Strengthening PBCR is vital to accurately assessing disease burden.
Conflict of Interest.
None declared.
Authors' Contributions
S.A. participated in study design, methodology, data interpretation, statistical analysis, patient recruitment, clinical data acquisition, follow-up, literature review, and support in manuscript drafting. P.B. was responsible for the concept and study design, methodology, data interpretation, statistical analysis, patient recruitment, critical revision of the manuscript, and supervision. R.K. contributed to the conceptualization, study design, clinical data acquisition, follow-up, data curation, and drafting the manuscript. N.K. was involved in conceptualization, study design, methodology, patient recruitment, and clinical data acquisition. Z.H. contributed to the conceptualization, statistical analysis, patient recruitment, clinical data acquisition, and follow-up. V.K.T. was responsible for data interpretation, statistical analysis, drafting the manuscript, and critical revision. R.R. participated in methodology, data interpretation, statistical analysis, and patient recruitment. R.K.S. contributed to conceptualization, study design, methodology, data interpretation, statistical analysis, data curation, and supervision. A.G. was involved in statistical analysis, critical revision of the manuscript, and supervision. J.P. was responsible for conceptualization, study design, methodology, data interpretation, statistical analysis, data curation, literature review, and support in manuscript drafting. All authors have read and approved the final version of the manuscript.
Patient Consent
Given the retrospective design of the study and the use of anonymized, de-identified data from the hospital-based cancer registry, the requirement for obtaining consent from patients or their legal guardians was waived.
Ethical Approval
Ethical clearance was obtained from the Institutional Ethics Committee of Indira Gandhi Institute of Medical Sciences, Patna, Bihar, Approval No: 28/IEC/IGIMS/2024.
References
- Bray F, Laversanne M, Sung H. et al. Global cancer statistics 2022: GLOBOCAN estimates of incidence and mortality worldwide for 36 cancers in 185 countries. CA Cancer J Clin 2024; 74 (03) 229-263
- Phillips SM, Padgett LS, Leisenring WM. et al. Survivors of childhood cancer in the United States: prevalence and burden of morbidity. Cancer Epidemiol Biomarkers Prev 2015; 24 (04) 653-663
- Arora RS, Eden TO, Kapoor G. Epidemiology of childhood cancer in India. Indian J Cancer 2009; 46 (04) 264-273
- Nandakumar A, Anantha N, Appaji L. et al. Descriptive epidemiology of childhood cancers in Bangalore, India. Cancer Causes Control 1996; 7 (04) 405-410
- Mathur P, Sathishkumar K, Chaturvedi M. et al; ICMR-NCDIR-NCRP Investigator Group. Cancer statistics, 2020: report from National Cancer Registry Programme, India. JCO Glob Oncol 2020; 6: 1063-1075
- Census of India. 2011. “District Census Data: Bihar.” Accessed November 15, 2025, at: https://www.census2011.co.in/census/state/districtlist/bihar.html
- Arora B, Banavali SD. Pediatric oncology in India: past, present and future. Indian J Med Paediatr Oncol 2009; 30 (04) 121-123
- Steliarova-Foucher E, Stiller C, Lacour B, Kaatsch P. International Classification of Childhood Cancer, third edition. Cancer 2005; 103 (07) 1457-1467
- Vemula S, Dhakshanamoorthy K. Epidemiology of cancer incidence estimates and statistics 2000–2025: analysis from National Cancer Registry Programme in India. Indian J Med Paediatr Oncol 2025; 46 (03) 278-287
- SEER. World (WHO 2000–2025) standard. NCI Surveillance, Epidemiology and End Results Program. (2024). Accessed May 28, 2024, at: https://seer.cancer.gov/stdpopulations/world.who.html
- Kaatsch P. Epidemiology of childhood cancer. Cancer Treat Rev 2010; 36 (04) 277-285
- Pandey A, Singh A, Kumar V. et al. Pediatric cancers in Bihar: a retrospective tertiary cancer center study. South Asian J Cancer 2020; 9 (01) 53-55
- Das S, Paul DK, Anshu K, Bhakta S. Childhood cancer incidence in India between 2012 and 2014: report of a population-based cancer registry. Indian Pediatr 2017; 54 (12) 1033-1036
- Fathi A, Bahadoram M, Amani F. Epidemiology of childhood cancer in Northwest Iran. Asian Pac J Cancer Prev 2015; 16 (13) 5459-5462
- Swaminathan R, Rama R, Shanta V. Childhood cancers in Chennai, India, 1990-2001: incidence and survival. Int J Cancer 2008; 122 (11) 2607-2611
- Satyanarayana L, Asthana S, Labani S P. Childhood cancer incidence in India: a review of population-based cancer registries. Indian Pediatr 2014; 51 (03) 218-220
- Jabeen S, Haque M, Islam MJ, Talukdar MH. Profile of pediatric malignancies. A five years study. J Dhaka Med Coll 2010; 19 (01) 33-38
- Hazarika M, Krishnatreya M, Bhuyan C. et al. Overview of childhood cancers at a regional cancer centre in North-East India. Asian Pac J Cancer Prev 2014; 15 (18) 7817-7819
- Sofi MA, Lone MM, Fatima K. et al. Profile of pediatric tumors: a 10-year study at a tertiary care center in North India. J Radiat Cancer Res 2022; 13 (03) 126-129
- Breslow NE, Beckwith JB, Perlman EJ, Reeve AE. Age distributions, birth weights, nephrogenic rests, and heterogeneity in the pathogenesis of Wilms tumor. Pediatr Blood Cancer 2006; 47 (03) 260-267
- Birch JM, Blair V. The epidemiology of infant cancers. Br J Cancer Suppl 1992; 18: S2-S4
- Stiller CA. International patterns of cancer incidence in adolescents. Cancer Treat Rev 2007; 33 (07) 631-645
-
Gurney JG, Severson RK, Davis S, Robison LL. Incidence of cancer in children in the United States. Sex-, race-, and 1-year age-specific rates by histologic type. Cancer 1995; 75 (08) 2186-2195 3.0.CO;2-F" target="linkout" data-target="CrossRef" data-id="CrossRef" data-url="https://doi.org/10.1002/1097-0142(19950415)75:8<2186>3.0.CO;2-F" style="color: rgb(1, 52, 118); outline-width: 0px; outline-color: transparent !important; padding-right: 10px;">Crossref PubMed Search in Google ScholarDownload RIS citation
- Dorak MT, Karpuzoglu E. Gender differences in cancer susceptibility: an inadequately addressed issue. Front Genet 2012; 3: 268
- Sathishkumar K, Chaturvedi M, Das P, Stephen S, Mathur P. Cancer incidence estimates for 2022 & projection for 2025: result from National Cancer Registry Programme, India. Indian J Med Res 2022; 156 (4–5): 598-607
- Bhopal SS, Mann KD, Pearce MS. Registration of cancer in girls remains lower than expected in countries with low/middle incomes and low female education rates. Br J Cancer 2012; 107 (01) 183-188
Address for correspondence
Publication History
Article published online:
14 March 2026
© 2026. The Author(s). This is an open access article published by Thieme under the terms of the Creative Commons Attribution License, permitting unrestricted use, distribution, and reproduction so long as the original work is properly cited. (https://creativecommons.org/licenses/by/4.0/)
Thieme Medical and Scientific Publishers Pvt. Ltd.
A-12, 2nd Floor, Sector 2, Noida-201301 UP, India
We recommend
- Geographical pattern of carcinoma gallbladder in Bihar and its association with river Ganges and arsenic levels: Retrospective individual consecutive patient da...Richa Madhawi, South Asian Journal of Cancer, 2018
- Epidemiological Profiling and Trends of Primary Intracranial Tumors: A Hospital-Based Brain Tumor Registry from a Tertiary Care CenterMukta Meel, Journal of Neurosciences in Rural Practice, 2021
- Analysis of Pediatric Burns in A Tertiary Burns Center in Istanbul, TurkeyF. Uygur, European Journal of Pediatric Surgery, 2009
- Clinico-Hematological Profile of Acute Leukemia Cases in Bihar: A Multiparameter Study in a Tertiary-Care HospitalShuchismita Shuchismita, et al., J Lab Physicians, 2022
- Adrenal Tumors in Children: Spectrum of Presentation and Surgical Approach in a Tertiary Care InstitutePrasanta Kumar Tripathy, TH Open, 2020
- EPIDEMIOLOGYAnthony Pak-Yin Liu, Neuro-Oncology, 2014
- Incidence and survival of children with central nervous system primitive tumors in the French National Registry of Childhood Solid TumorsEmmanuel Desandes, Neuro-Oncology, 2014
- Rare cancers in Japan: definition, clinical features and future perspectivesAkira Kawai, Japanese Journal of Clinical Oncology, 2020
- NEURO-ONCOLOGY IN DEVELOPING COUNTRIESNeuro-Oncology, 2012
- LINC-40. VERY YOUNG PATIENTS AND CENTRAL NERVOUS SYSTEM TUMORS: A SINGLE-CENTER EXPERIENCE IN AN UPPER-MIDDLE-INCOME COUNTRY<svg viewBox="0 0 24 24" fill="none" xmlns="http://www.w3.org/2000/svg">
</svg> Claudia Madrigal-Avila, Neuro-Oncology
Fig 1: Heat-map illustrating the proportional distribution of major childhood cancers by age groups. Note: Each value indicates the percentage of that cancer type within the corresponding age category, with darker shades representing higher proportions. ALL, acute lymphoblastic leukemia; AML, acute myeloid leukemia; CML, Chronic myeloid leukemia); HL, Hodgkin lymphoma; NHL, non-Hodgkin lymphoma.
Fig 2: Time trends of the top five pediatric malignancies (2023–2025) from the hospital-based cancer registry (HBCR). ALL, acute lymphoblastic leukemia; HL, Hodgkin lymphoma.
References
- Bray F, Laversanne M, Sung H. et al. Global cancer statistics 2022: GLOBOCAN estimates of incidence and mortality worldwide for 36 cancers in 185 countries. CA Cancer J Clin 2024; 74 (03) 229-263
- Phillips SM, Padgett LS, Leisenring WM. et al. Survivors of childhood cancer in the United States: prevalence and burden of morbidity. Cancer Epidemiol Biomarkers Prev 2015; 24 (04) 653-663
- Arora RS, Eden TO, Kapoor G. Epidemiology of childhood cancer in India. Indian J Cancer 2009; 46 (04) 264-273
- Nandakumar A, Anantha N, Appaji L. et al. Descriptive epidemiology of childhood cancers in Bangalore, India. Cancer Causes Control 1996; 7 (04) 405-410
- Mathur P, Sathishkumar K, Chaturvedi M. et al; ICMR-NCDIR-NCRP Investigator Group. Cancer statistics, 2020: report from National Cancer Registry Programme, India. JCO Glob Oncol 2020; 6: 1063-1075
- Census of India. 2011. “District Census Data: Bihar.” Accessed November 15, 2025, at: https://www.census2011.co.in/census/state/districtlist/bihar.html
- Arora B, Banavali SD. Pediatric oncology in India: past, present and future. Indian J Med Paediatr Oncol 2009; 30 (04) 121-123
- Steliarova-Foucher E, Stiller C, Lacour B, Kaatsch P. International Classification of Childhood Cancer, third edition. Cancer 2005; 103 (07) 1457-1467
- Vemula S, Dhakshanamoorthy K. Epidemiology of cancer incidence estimates and statistics 2000–2025: analysis from National Cancer Registry Programme in India. Indian J Med Paediatr Oncol 2025; 46 (03) 278-287
- SEER. World (WHO 2000–2025) standard. NCI Surveillance, Epidemiology and End Results Program. (2024). Accessed May 28, 2024, at: https://seer.cancer.gov/stdpopulations/world.who.html
- Kaatsch P. Epidemiology of childhood cancer. Cancer Treat Rev 2010; 36 (04) 277-285
- Pandey A, Singh A, Kumar V. et al. Pediatric cancers in Bihar: a retrospective tertiary cancer center study. South Asian J Cancer 2020; 9 (01) 53-55
- Das S, Paul DK, Anshu K, Bhakta S. Childhood cancer incidence in India between 2012 and 2014: report of a population-based cancer registry. Indian Pediatr 2017; 54 (12) 1033-1036
- Fathi A, Bahadoram M, Amani F. Epidemiology of childhood cancer in Northwest Iran. Asian Pac J Cancer Prev 2015; 16 (13) 5459-5462
- Swaminathan R, Rama R, Shanta V. Childhood cancers in Chennai, India, 1990-2001: incidence and survival. Int J Cancer 2008; 122 (11) 2607-2611
- Satyanarayana L, Asthana S, Labani S P. Childhood cancer incidence in India: a review of population-based cancer registries. Indian Pediatr 2014; 51 (03) 218-220
- Jabeen S, Haque M, Islam MJ, Talukdar MH. Profile of pediatric malignancies. A five years study. J Dhaka Med Coll 2010; 19 (01) 33-38
- Hazarika M, Krishnatreya M, Bhuyan C. et al. Overview of childhood cancers at a regional cancer centre in North-East India. Asian Pac J Cancer Prev 2014; 15 (18) 7817-7819
- Sofi MA, Lone MM, Fatima K. et al. Profile of pediatric tumors: a 10-year study at a tertiary care center in North India. J Radiat Cancer Res 2022; 13 (03) 126-129
- Breslow NE, Beckwith JB, Perlman EJ, Reeve AE. Age distributions, birth weights, nephrogenic rests, and heterogeneity in the pathogenesis of Wilms tumor. Pediatr Blood Cancer 2006; 47 (03) 260-267
- Birch JM, Blair V. The epidemiology of infant cancers. Br J Cancer Suppl 1992; 18: S2-S4
- Stiller CA. International patterns of cancer incidence in adolescents. Cancer Treat Rev 2007; 33 (07) 631-645
-
Gurney JG, Severson RK, Davis S, Robison LL. Incidence of cancer in children in the United States. Sex-, race-, and 1-year age-specific rates by histologic type. Cancer 1995; 75 (08) 2186-2195 3.0.CO;2-F" target="linkout" data-target="CrossRef" data-id="CrossRef" data-url="https://doi.org/10.1002/1097-0142(19950415)75:8<2186>3.0.CO;2-F" style="color: rgb(1, 52, 118); outline-width: 0px; outline-color: transparent !important; padding-right: 10px;">Crossref PubMed Search in Google ScholarDownload RIS citation
- Dorak MT, Karpuzoglu E. Gender differences in cancer susceptibility: an inadequately addressed issue. Front Genet 2012; 3: 268
- Sathishkumar K, Chaturvedi M, Das P, Stephen S, Mathur P. Cancer incidence estimates for 2022 & projection for 2025: result from National Cancer Registry Programme, India. Indian J Med Res 2022; 156 (4–5): 598-607
- Bhopal SS, Mann KD, Pearce MS. Registration of cancer in girls remains lower than expected in countries with low/middle incomes and low female education rates. Br J Cancer 2012; 107 (01) 183-188